
Restriction Digest
Choose enzymes and see what they do to the sequence: every recognition site on both strands, the fragments a digest produces, and those fragments as bands on a virtual gel.
| Reached by | Tools → Restriction Digest |
| Sample project | Virtual gel bench |
What it does
A restriction digest is the cheapest identity test in molecular biology. You cut a construct with enzymes whose sites you know, run the pieces out on a gel, and compare what you see with what the sequence predicts. If the pattern matches, the clone is probably what you think it is; if a band is the wrong size or missing, something is wrong and the pattern usually tells you what.
This panel does the predicting half. Give it a molecule and one or more enzymes, and it reports every recognition site on both strands, the fragments those cuts produce — with the coordinates, the cutter at each end and the overhang each cut leaves — and then places those fragments as bands on a virtual gel positioned by a real migration model, so you can compare the prediction against a photograph of your actual gel.
Each lane carries its own enzyme combination. That is the whole point of the layout: the way you tell two candidate clones apart is by finding an enzyme, or a pair, whose pattern differs between them, and the way you find it is to put several digests side by side on one gel.
When you'd use this
Used in: Clone an insert into a vector, and prove it worked · Optimize a coding sequence for expression in another host
- "Is this clone right?" — the diagnostic digest. Pick two or three enzymes with sites in your insert and your backbone, and look for a fragment whose size is unambiguous on a gel. A wrong orientation, a lost insert and an empty vector all give different patterns.
- "Which enzyme should I use?" — the picker shows every enzyme with its real cut count on this molecule, so a single cutter, a non-cutter and a shredder are distinguishable before you commit. Non-cutters matter as much as cutters: an enzyme that does not touch your insert is what you use to linearise the vector.
- "What ends will I get?" — the fragment table names the overhang each cut leaves, which is what decides whether two pieces will ligate. Fragments hand off directly to Ligation.
- "Which gel should I pour?" — a 31 bp fragment and a 4 kb fragment are not resolvable on the same gel. Set an agarose percentage and the panel tells you what that gel resolves and which of your fragments fall outside it.
What this computes
-
Every cut site on both strands with full IUPAC ambiguity, so an enzyme written
GGYANNNNNNTCGmatches both the C and the T form, and sites spanning the origin of a circular molecule are found — which a naive linear scan misses -
Each fragment's boundaries in 1-based inclusive coordinates, with both cutters and both overhangs derived from that enzyme's own top- and bottom-strand offsets rather than from a fixed rule — which is why Type IIS enzymes, cutting at a distance outside their recognition site, come out right
-
Each fragment's molar mass
-
Topology honoured, and stated above the controls: a circular molecule cut once yields one linear fragment, the same molecule linear yields two
-
A virtual gel of the fragments, on the same migration model the gel bench uses, checked against pydna
-
Which bands the gel will merge. The run's reading, above the picture, names the fragment pairs that land closer together than the gel draws a band and therefore arrive as one band — with the separation and the band width that produced the verdict (220 and 221 bp, 504 and 517 bp … the closest pair is 0.4 px apart where the band is 4.3 px wide). Counting bands on such a gel undercounts the fragments, and this is the readout that says by how many. The criterion is the drawing's own — where the engine puts each band and how thick it draws it — never a base-pair cutoff chosen for you, which is why the same two fragments merge on one gel and separate on a sharper one. The reading points at the pair rather than only describing it: it carries the two fragment sizes as a chip you can follow to the band, and the band you land on names the OTHER fragment sharing it, with its own action — because a merged band is two fragments, and picking one of them silently is the mistake the reading exists to prevent
-
The rest of the reading, generated from the run and earned rather than boilerplate: each fragment outside the gel's resolving window named by size, with the window it fell outside of, that it is placed by damped extrapolation, and that it is not a number to read a size off · why partial digest is unavailable, with the cut count that bounded it · a calibration that was refused, quoted · a lane whose enzymes ran and found no sites, stated as an answer rather than left as an empty lane · a lane with no enzyme chosen at all, which is not an error but does mean the lane runs uncut and the whole molecule is its only band — said next to a link to the control that fixes it. A clean gel says nothing at all
-
Where each enzyme could ALSO cut if the reaction goes off-spec — its star sites. Under non-standard conditions (low ionic strength, high pH, Mn²⁺ in place of Mg²⁺, glycerol, DMSO, some detergents) many restriction enzymes cleave sequences that differ from their recognition site at one position. Where REBASE reports star activity for an enzyme experimentally, the run counts those possible sites on your own molecule and can draw every one of them on the map, sequence and linear views, each carrying the variant it matched and the single base that differs. This is the readout for a digest that ran long or in the wrong buffer and gave a band pattern that reads as the wrong clone. It is a statement about possibility, not a prediction of cleavage, and it is never ranked: the authority says explicitly that different star sites are cut at different rates and that not every possibility has been tested
-
How much of that question is actually covered. Star activity has been examined experimentally for a minority of known enzymes, so the reading says how many of the enzymes in your lanes were examined at all — examined 2 of 3 — and names the ones that were not. An enzyme nobody has tested is reported as untested, never as clean
-
Whether your own prep's methylation stops the digest, site by site. A plasmid grown in an ordinary E. coli strain carries Dam, Dcm and — from a mammalian or in vitro source — CpG methylation, and many restriction enzymes will not cut a site that carries it. The run reports this localised to your molecule rather than as a property of the enzyme: MboI (Dam, 22 of 22 sites) is a different statement from Dam blocks MboI, and only the first is about the DNA in your tube. Where a site is affected the reading says so above the gel — the bands drawn are the digest an unmethylated template would give — and names the way out: a dam⁻/dcm⁻ strain, or an isoschizomer that is not blocked. Every modified base can be drawn on the map, sequence and linear views, coloured by what the methylation does to the cut
-
How much of THAT question is covered. Methylation sensitivity has been measured for a minority of known enzymes, so the reading separates three answers a single count would blur: examined and clear here, examined and blocked here, and never examined against any methylase. An enzyme nobody has tested is reported as untested, never as clean
-
The stain in the gel. Pick the dye you actually ran — ethidium bromide, SYBR Safe, SYBR Gold or GelRed — and the bands take that dye's own colour, derived from its published emission maximum rather than chosen. A digest saved as a tab reopens with the dye it was run with, not today's setting
-
What to set the digest up in, lane by lane. For each lane's enzyme combination the panel names the buffer to use and how much activity the slowest enzyme in that lane has in it, the incubation temperature, any cofactor the reaction requires, and how to stop it. The buffer is not simply the one with the highest activity: an enzyme that cuts fast in a buffer where it also cleaves sites it should not is the wrong choice, so a buffer where any enzyme in the lane shows star activity is ruled out whatever its percentage, and every buffer's fit is shown so that splitting the digest into two tubes is a decision you can make rather than a verdict you are handed. Where the lane needs two incubation temperatures, it says so instead of picking one. Stopping the reaction is part of the answer: heat does not inactivate every enzyme, one heat-resistant enzyme in the lane makes the whole lane heat-resistant, and the temperature needed is the highest any member requires — heating to the lower figure leaves the other enzyme running. An enzyme with no published answer is named as unknown rather than reported as either
-
The chain, folded away: what positioned every band (ladder-calibrated, with no concentration term at all, or the law and percentage you chose), which curve calibrated it, how the gel is drawn, the resolving window, whether partials were included, and the star-activity coverage for this run
Why the overhangs are the part to get right: the overhang decides what will ligate to what, and a single overhang reported backwards silently changes which assemblies are predicted to work.
Out: the fragment table, the gel as an image, the fragments as CSV, the whole run as its own editor tab, and the lanes as a hand-off to the Virtual Gel Bench or to Ligation.
Where it lives
Tools → Restriction Digest, or the command palette. It reads the active molecule — its sequence, its topology and your current selection — and writes back to the canvas: clicking a band or a table row selects that fragment's range on the map, so a size on the gel becomes a region in the sequence.
Inputs and outputs
In: the loaded nucleotide record, whole or as a selection, circular or linear — the topology is not cosmetic here. A circular molecule cut once yields one linear fragment; the same molecule linear yields two. The panel states which topology it is acting on above the controls.
Out: the fragment table (1-based, inclusive coordinates, with both cutters, both overhangs and each fragment's molar mass), the virtual gel as an image, the fragments as CSV, the whole run as a new editor tab, and the lanes as a hand-off to the Virtual Gel Bench or to Ligation.
What it refuses, and says so: an enzyme that has no site on this molecule leaves the lane uncut, and the lane draws the intact molecule as one band in its own topology (a circular plasmid as supercoiled, which moves it under Helling–Goodman–Boyer), with the note "No sites on this molecule: the lane runs uncut, so the intact molecule is its only band." Partial digests are enumerated only up to 10 cut sites; above that the control switches off and shows the actual count, because the enumeration pairs every cut with every cut and grows as the square of the cut count. A custom size ladder with an unusable calibration table is rejected with the specific reason, next to the field you typed it in.
Worked example
Open the Virtual gel bench sample project and target SYNPBR322 — pBR322, 4,361 bp, circular.
Add EcoRI, HindIII and BamHI to one lane. Each cuts exactly once, at 4,359, 29 and 375, so a
circular molecule gives three fragments:
| Fragment | Start | End | Length | Left cutter | Right cutter | MW |
|---|---|---|---|---|---|---|
| 1 | 376 | 4,359 | 3,984 bp | BamHI | EcoRI | 2,461.5 kDa |
| 2 | 30 | 375 | 346 bp | HindIII | BamHI | 213.9 kDa |
| 3 | 4,360 | 29 | 31 bp | EcoRI | HindIII | 19.3 kDa |
Fragment 3 spans the origin — it starts at 4,360, runs off the end and continues at 1 — which is exactly what a circular molecule should do and what a linear-only tool gets wrong.
The arithmetic is your check on the whole run. A complete digest cuts the molecule up and throws nothing away, so the fragment lengths add back to the molecule: 3,984 + 346 + 31 = 4,361 bp. The fragment count follows the topology — a circular molecule gives one fragment per cut, a linear one gives cuts + 1, which is why three single cutters give three fragments here and would give four on the same sequence opened out. If the lengths do not sum, you are not looking at a complete digest: either partials are switched on, or the lane is reporting something other than the molecule you think is loaded.
The band count is a different number, and it is the one that can legitimately disagree. Two fragments close in size arrive at the same place on the gel, so ten fragments can reach you as eight bands — the HinfI reading below is exactly that case. Count fragments in the table; count bands in the picture; the reading above the gel names the pairs that merged so the difference is never left for you to discover from a photograph.
Reading the MW column
MW is the fragment's molar mass, in kilodaltons, and it is there so you can weigh a gel band in moles instead of nanograms. Ligation is a molar reaction: what matters is how many insert molecules face how many vector molecules, and two fragments of the same mass at different lengths are wildly different numbers of molecules. Divide the nanograms you load by the kilodaltons and you have picomoles — 100 ng of fragment 2 is about 0.47 pmol, while 100 ng of fragment 1 is 0.04 pmol, an order of magnitude fewer molecules from the same amount of DNA.
The estimate is the standard one from length: about 617.8 daltons per base pair plus the two free ends. It is the same figure the virtual gel uses to decide how bright each band is, so the number in the table and the picture beside it are always talking about the same molecule. It does not read the fragment's own base composition, which would shift it by a fraction of a percent for a GC-rich or AT-rich piece and is far below the accuracy of any pipette.
If you want the ligation set up for you rather than the arithmetic, hand the lane to Ligation — its molar-ratio helper takes the nanograms of vector and the ratio you want and tells you the nanograms of insert.
Now set Agarose to 3.0 %. The panel reports "Resolves 50 bp – 1 kb" and warns that 2 of the 3 fragments sit outside that window: the 3,984 bp fragment is too large for a 3 % gel and the 31 bp fragment is too small even for that. Switch to 1.0 % and the 3,984 bp fragment comes into range while the two small ones do not. That is a real experimental decision, and it is the reason the resolving window is on screen rather than in a manual: no single gel shows all three.
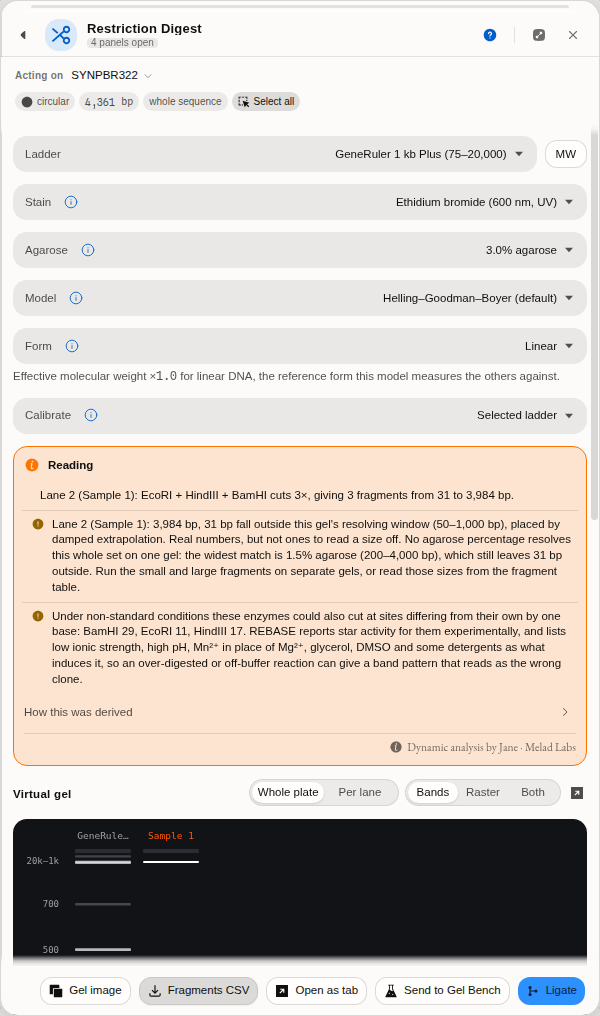 The worked example on a 3 % gel. The gel resolves 50 bp – 1 kb, and the panel says so — together
with the fact that two of the three fragments fall outside that window and are therefore placed by
extrapolation rather than measured.
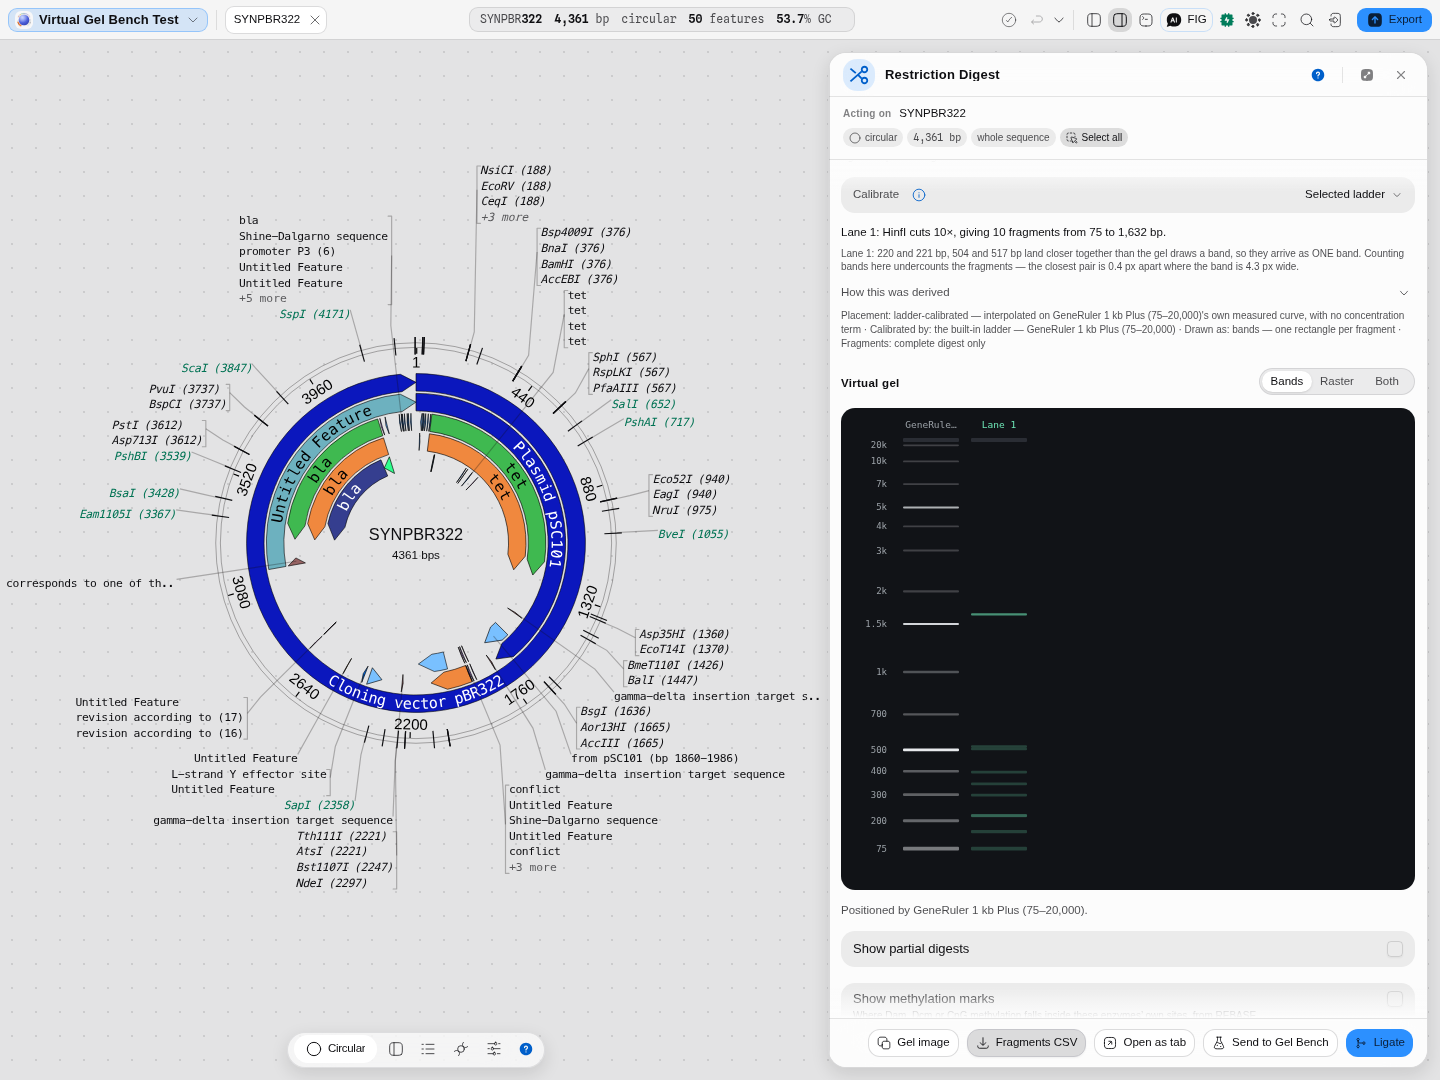 HinfI on the real pBR322 of the Virtual gel bench starter: 10 cuts, 10 fragments from 75 to
1,632 bp — and two pairs that arrive as one band (220/221 and 504/517 bp). Read it against the gel
drawn beside it, where the bands between 200 and 500 bp are visibly fewer than the fragment table's
rows. The chain is open underneath, naming the ladder-calibrated placement and that it carries no
concentration term.
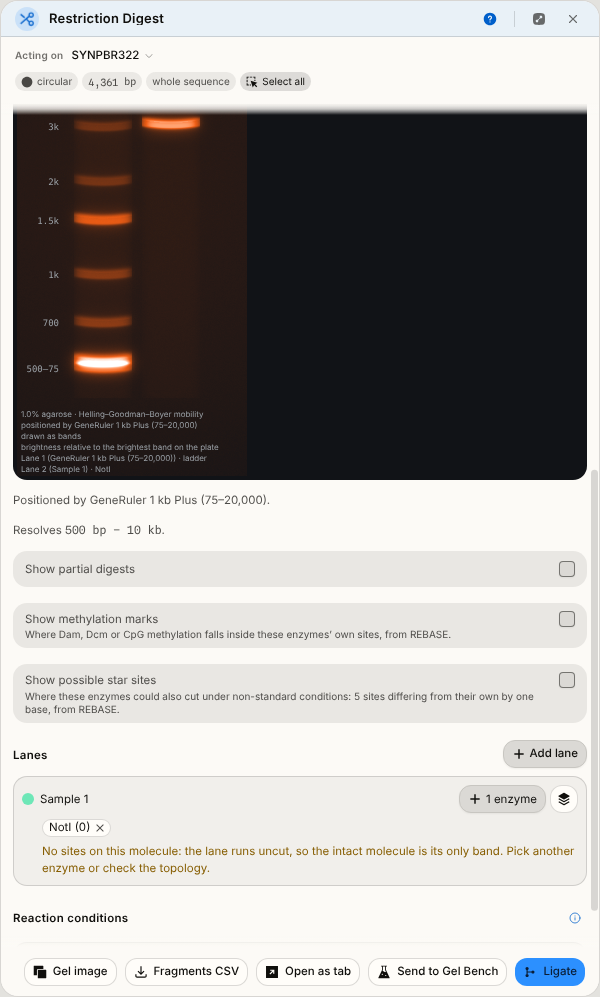
NotI has no site in pBR322. The lane is empty, and it says why — an empty lane is never left to
mean "the run failed". Behind it, the fragment table for the three-enzyme lane.
Controls
The digest
- Lanes. Add as many as you like; each has its own name, colour and enzyme set.
- Enzyme picker, showing each enzyme's cut count on this molecule, scoped to your active enzyme collection when you have one set. Your own custom enzymes appear alongside the built-in ones. With a collection active the picker also offers Add all N from <collection>, so a working set — your six Type IIS enzymes, your twelve common cutters — goes onto the lane in one action; N is what is still missing, and anything you added from outside the collection is kept.
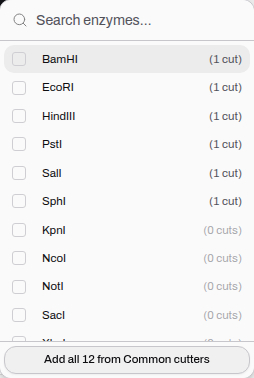 Cut counts are for the molecule in front of you, so the six enzymes that cut pBR322 sort above the
six that do not.
- Load collection (the stack icon beside the picker) — put a whole saved collection into a lane in one click, which is the fast way to run a diagnostic digest against a standard set rather than ticking twenty boxes. It replaces the lane's enzymes rather than adding to them, so the lane holds exactly the set you named, and it tells you up front how much of the collection it can supply: a collection naming an enzyme this catalogue does not carry loads as "4 of 6", never quietly as four.
- Show partial digests — includes the products of incomplete cutting, which is what you actually see when a digest is under-timed or an enzyme is star-active. Limited to 10 sites, with the count shown when it switches off.
The gel
- Ladder — a real Rf-calibrated size marker, GeneRuler 1 kb Plus (75–20,000) by default. The ladder both calibrates the migration curve and is drawn, so marks and sample bands always share one physical scale.
- Agarose % — off by default (bands are placed by the ladder's own calibration curve). Setting a percentage switches to a concentration model; see Algorithms below. The list is the ten percentages those laws are defined at, plus Custom percentage… for the gel you actually poured — 0.9 %, say, which is reported as "modelled at 0.8 %, the nearest percentage this law is defined at" rather than silently rounded.
- Model — which empirical mobility law drives migration, when a percentage is set.
- Form — the DNA topology: linear, supercoiled, nicked or relaxed. Supercoiled DNA is compact and runs ahead of linear DNA of the same length; nicked and relaxed circles run behind it. This is the single most common reason an uncut plasmid "runs at the wrong size".
- Calibrate — position the whole gel by your own gel photo instead of a catalogue ladder. Type
the
(bp, Rf)pairs you measured and the gel is re-positioned on your curve. - Draw as: Bands · Raster · Both. Bands draws one clickable rectangle per fragment. Raster draws the gel the way a camera sees it: each band a Gaussian smear whose brightness follows its mass, summed into the lane, so two fragments of similar size merge into one fat band exactly as they do on a photograph. Both overlays the rectangles on the smear. All three read the same placement, so they can never disagree about where a band sits.
- Whole plate · Per lane — what band brightness is measured against. A digest that leaves one large fragment and one small one is the case that separates them: under Whole plate every band is scaled to the brightest band on the gel, so the small fragment draws almost black and the two are honestly comparable; under Per lane each lane is scaled to its own brightest band, so both are legible and their brightnesses can no longer be compared with any other lane's. The caption under the plate names whichever drew it, and travels with the exported image.
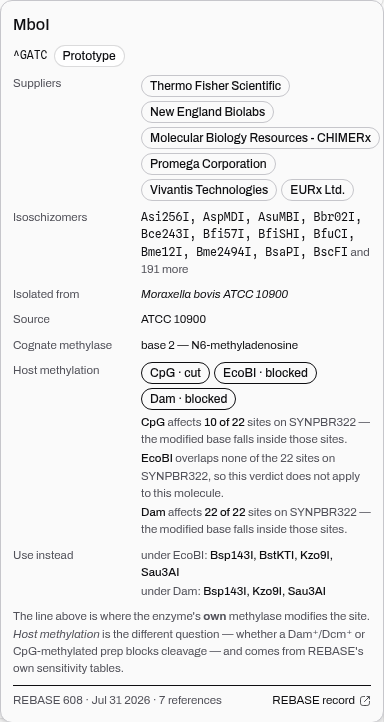
Every enzyme chip opens its full record — recognition site with the cut position marked, prototype status, star-activity warning, commercial suppliers, isoschizomers, source organism, and the cognate methylase's modification site.
Partial digests, and when you want them
Ladder-calibrated migration (the default). No concentration term at all. A natural cubic spline
is fitted through a real marker ladder's measured (length, Rf) points, and every band is placed on
that curve. This is the most honest model when you have a ladder you trust, because it is
interpolation between measurements rather than extrapolation from a formula.
Helling–Goodman–Boyer, when you set a percentage. Mobility is log-linear in fragment length between the bounds of the gel's resolving window, with a damped extrapolation outside it so a band that cannot be resolved still lands at a sane place instead of running off the gel. The resolved window fills the lane less a thin strip at each end, and the unresolved bands are packed into those strips, so size order holds everywhere: a 20 kb band always sits above a 10 kb one, and a 75 bp band below a 500 bp one, even though neither is a size to read off. It carries the DNA-form factors, so it is the model to use whenever topology matters. This is the default when a percentage is set.
Rill/Van Winkle, the published reciprocal-mobility crossover. It is offered as a scientifically distinct alternative rather than a correction: it describes the transition between size regimes differently, as an exponential crossover in reciprocal mobility between a short-DNA limit and a long-DNA limit. Both the form and the parameters are the authors' own — the crossover length and the long-to-short mobility ratio come from their measured fit across 0.5 % to 1.5 % agarose, at the one field strength (2.78 V/cm) at which they swept concentration end to end. Checked against their own published figures for that table.
Will your prep's methylation stop the digest?
Growing a plasmid in an ordinary E. coli strain methylates it: Dam marks the A in GATC,
Dcm the second C in CCWGG, and mammalian or in vitro CpG methylation the C in CG. Some
enzymes are blocked by that, and the question people usually get wrong is which of my own sites is
affected — because half the blocked enzymes are only blocked when a methylation target happens to
overlap the site.
Click an enzyme's name in a lane and its record opens with Host methylation, answered twice: the verdict for the enzyme, and what it does to this molecule.
- MboI on pBR322 —
Dam · blocked, and 22 of 22 sites. Its own siteGATCis the Dam target, so every site it cuts is methylated. Grow the plasmid in adam⁻strain, or use the isoschizomer the record names under Use instead (Sau3AI cuts regardless). - ClaI on pBR322 —
Dam · blocked, and none of the 1 site.ATCGATbecomes a Dam target only inGATCGATorATCGATC, and pBR322's single site is in neither context. The textbook warning is real and does not apply to this plasmid. - BamHI —
Dam · cut, in context on its site.GGATCCcontainsGATCand is methylated, and BamHI cuts it anyway. This is the case a "does my site contain GATC?" rule gets wrong, which is why the answer comes from measured records rather than from pattern-matching.
Absence is never shown as safety: an enzyme with no published verdict says "Not tested", because plenty of enzymes are affected and simply untested — BclI, the textbook Dam-blocked enzyme, is one of them.
Show methylation marks draws the answer: each modified base inside your sites becomes a mark on the sequence, linear and circular views, coloured by what the methylation does to the cut, with the methylase and the evidence in its tooltip. The counts and contexts are checked against REBASE's own methylation-sensitivity records, including which base each methylase modifies.
The resolving window per percentage, which the panel quotes for whichever gel you pick:
| Agarose | Resolves |
|---|---|
| 0.5 % | 1 kb – 30 kb |
| 0.7 % | 800 bp – 12 kb |
| 0.8 % | 800 bp – 12 kb |
| 1.0 % | 500 bp – 10 kb |
| 1.2 % | 400 bp – 7 kb |
| 1.5 % | 200 bp – 4 kb |
| 2.0 % | 100 bp – 2 kb |
| 2.5 % | 100 bp – 1.5 kb |
| 3.0 % | 50 bp – 1 kb |
| 4.0 % | 25 bp – 500 bp |
The law is defined at those ten percentages. If you ask for one in between, the nearest is used and the panel says which — it will not quietly model a 3.7 % gel as though the number meant something.
The science
Finding the sites. Recognition sequences are matched on both strands with full IUPAC ambiguity,
so an enzyme whose site is written GGYANNNNNNTCG matches both the C and the T form. Sites that
span the origin of a circular molecule are found, which a naive linear scan misses. Each cut carries
its own top- and bottom-strand offsets, which is how the overhang is derived rather than guessed —
and why Type IIS enzymes, which cut at a fixed distance outside their recognition site, are handled
correctly.
Why overhangs are the part to get right. The overhang decides what will ligate to what. A 5′ four-base overhang left by one enzyme will anneal to the same overhang left by a different enzyme (that is what an isoschizomer or a compatible-cohesive pair is), while a blunt end will ligate to any other blunt end, inefficiently. Getting a single overhang backwards silently changes which assemblies are predicted to work.
Migration. DNA in a gel separates by length because longer molecules are retarded more by the matrix, roughly logarithmically over the range a given gel resolves. Outside that range the relationship flattens at both ends: very large fragments all pile up near the well, and very small ones all run near the dye front. That flattening is why a resolving window is a real experimental constraint and not a rule of thumb, and why the panel names it.
Some enzymes have a known site and an unknown cut, and the tool says which. REBASE draws a distinction that is easy to miss: it records a recognition sequence for thousands of enzymes, but it states a cleavage position — where the phosphodiester backbone is actually broken, on each strand — for only about a third of them. The rest are isoschizomers whose site was established without anyone determining where they snip. That is a real gap in the literature, not a gap in the record, and those enzymes appear in the picker reading cut site unknown rather than with a plausible number beside them. They can be searched and read about; they cannot be used to cut, because nobody knows where they would. If one of them is what you have on the shelf, its record names the enzymes that recognise the same sequence and whose cut REBASE does state.
Provenance of correctness. Recognition sequences, cleavage positions and enzyme records all come from REBASE, release 608, and the cutting table is generated from that release rather than maintained by hand — so it cannot drift from the authority between refreshes. Cleavage geometry is cross-checked three ways: against REBASE's own machine-readable cut file, against the tabbed Type II format, and against Biopython enzyme by enzyme. The migration model, the intensity and spread of each band and the rendered gel image are all checked against pydna's implementation to nine decimal places, and the agarose laws against their published forms.
Will your prep block the enzyme?
A plasmid grown in an ordinary E. coli strain comes back methylated. Dam methylase marks the
adenine in GATC; Dcm marks the second cytosine in CCWGG. If either site overlaps your enzyme's
recognition sequence, the enzyme may cut slowly, or not at all — and a digest that simply fails is
one of the most common reasons a cloning day is lost.
This is a different question from the one an enzyme's own record usually answers. Every restriction enzyme has a cognate methylase that protects the host's own DNA at the same site; that is a fact about the bacterium the enzyme came from, and it tells you nothing about your prep. What you need is the host methylation verdict: given Dam⁺ or Dcm⁺ DNA, does this enzyme still cut?
Open any enzyme's record and both are there, labelled apart. The verdict is REBASE's own, in its own three words:
| cut | methylation of the overlapping site does not stop it |
| impaired | it still cuts, but more slowly or incompletely — plan for a longer digest, and do not trust a faint band |
| blocked | it does not cut methylated DNA. Grow the plasmid in a Dam⁻/Dcm⁻ strain, or use a different enzyme |
| not tested | REBASE reports no experiment. This is not a fourth verdict meaning "fine" |
That last row is the one to read carefully. BclI recognises TGATCA, which contains GATC, and
every bench protocol tells you to grow the plasmid Dam⁻ before using it — and REBASE still records no
tested verdict for it. An interface that rendered silence as safety would give you the most
confidently wrong answer it is capable of, so this one says not tested and leaves the judgement
with you.
And when an enzyme is blocked, the panel names the way out. Enzymes that recognise the same
sequence do not necessarily share a methylation sensitivity: MboI and Sau3AI both cut GATC, Dam
blocks MboI, and Sau3AI cuts straight through it. That pair is the classic case, and it is why
Use instead lists the isoschizomers REBASE has tested and found still cutting — never one it has
merely not tested.
MboI on pBR322. CpG methylation leaves it alone, EcoBI and Dam both block it, and the panel
answers the next question without being asked: Bsp143I, Kzo9I or Sau3AI will cut the same site in
Dam⁺ DNA.
Limitations
- The percentage model is empirical. It reproduces the behaviour of a standard gel; it knows nothing about your buffer, your voltage, your run time or your DNA concentration. Use it to choose a gel and to predict a pattern, not to predict a photograph.
- The Rill/Van Winkle law was measured between 0.5 % and 1.5 % agarose, at one field strength. Choose a percentage outside that span and the panel tells you which measured value is being used instead — every percentage beyond the fit gives the same gel, so the control stops doing anything and says so. The field dependence is real and is not modelled: the authors measure the long-DNA limiting mobility rising by about 80 % between 0.71 and 5.00 V/cm, so a gel run far from 2.78 V/cm separates differently from what this law predicts. Helling–Goodman–Boyer is defined out to 4 % and is the default for that reason.
- Methylation sensitivity is reported where it has been measured, and only there. REBASE has tested 380 enzymes against Dam, Dcm, CpG, EcoBI and EcoKI methylation, and those verdicts are shown. For every other enzyme the panel says not tested — which is not the same as safe, and is never drawn as if it were. See "Will your prep block the enzyme?" above.
- Star activity is flagged, not predicted. An enzyme known to cut at relaxed specificity under some conditions is marked, but which conditions do it is not modelled.
- Partial digests above 10 sites are not enumerated, for combinatorial reasons.
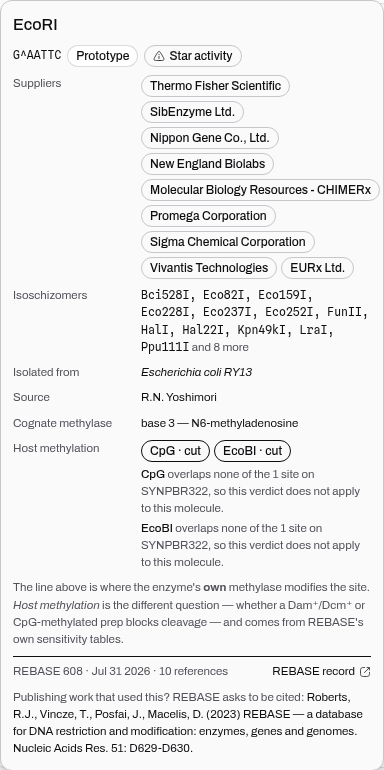 Clicking an enzyme's name opens its record: the site with the cut marked, prototype status, a star-
activity warning, who sells it, its isoschizomers, the organism it came from, and the site its own
methylase modifies — with the note that this is a different question from whether a Dam⁺ or Dcm⁺
prep blocks it.
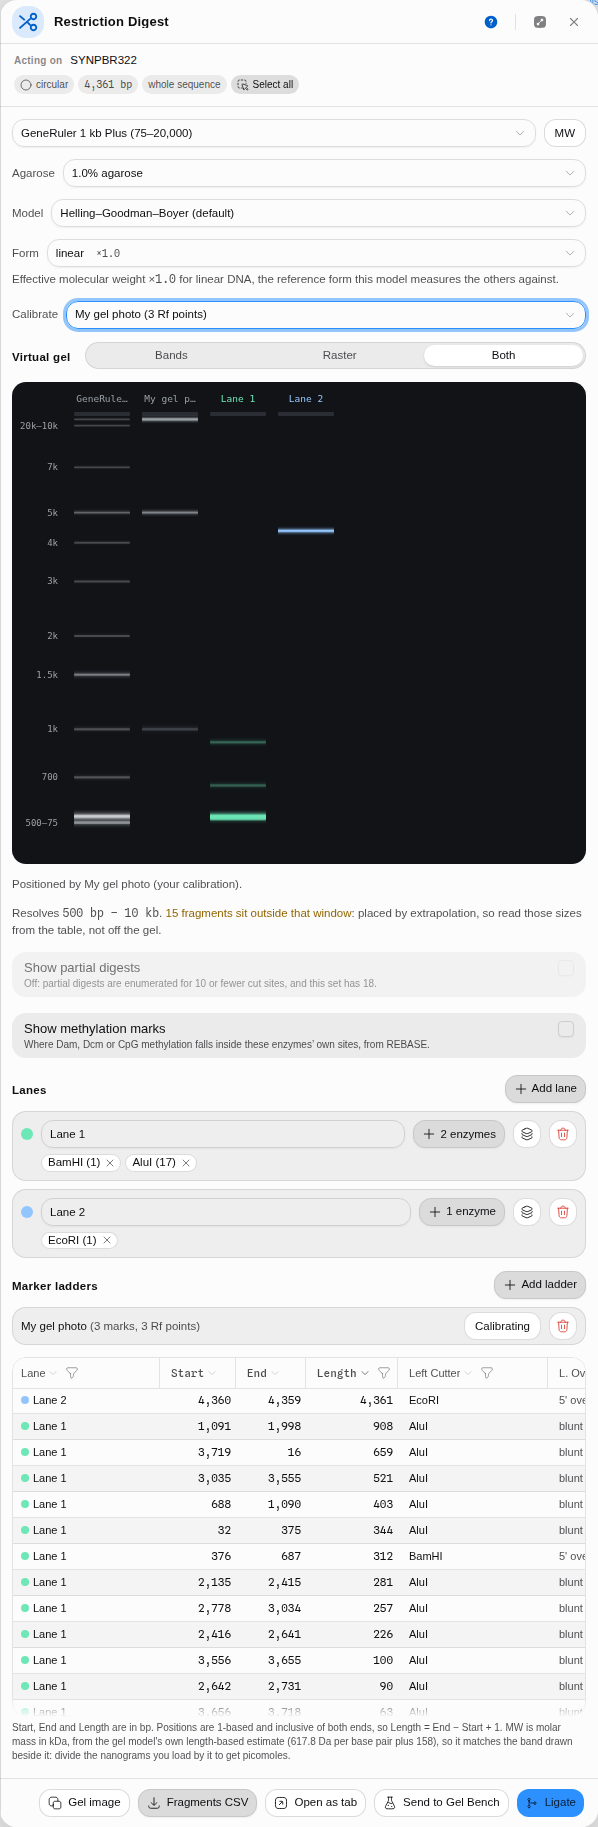 Calibrating on your own gel photo. Enter the
(bp, Rf) pairs you measured and the whole gel — the
catalogue ladder included — is repositioned on your curve, with the caption naming what is driving
it.
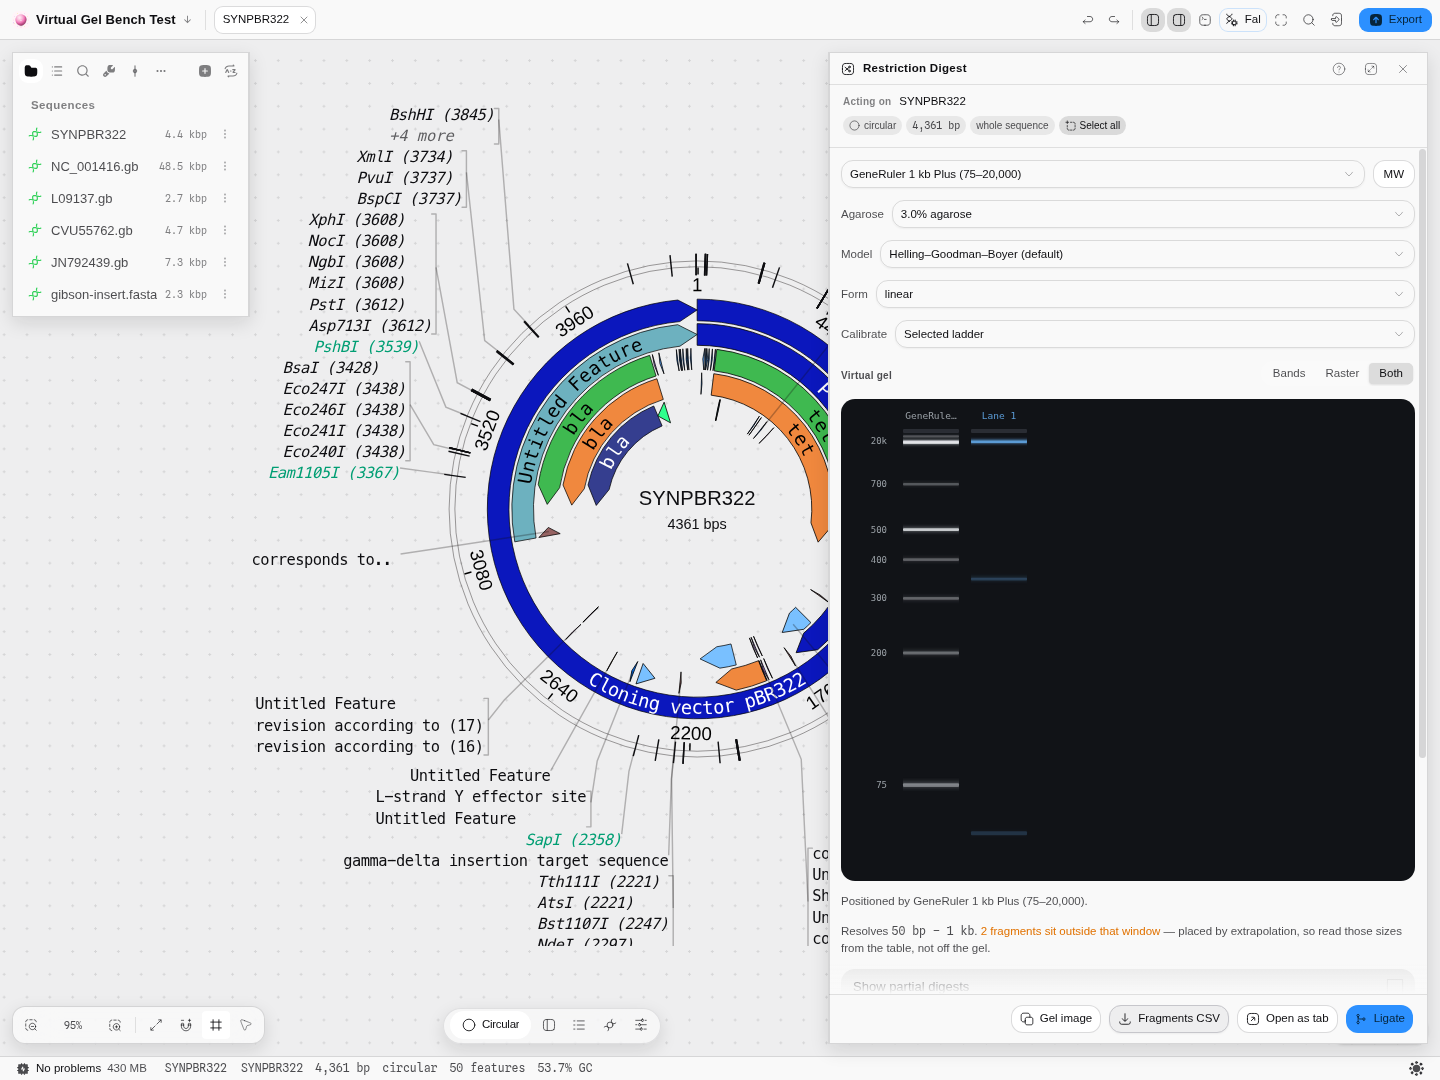 Both mode: the camera-like smear with the measurable rectangles drawn over it. Both are placed by
the same numbers, so they cannot disagree about where a band sits.
Export
The gel as a PNG image, the fragments as CSV, the whole run as a new editor tab, and the fragments as lanes into the Virtual Gel Bench or as molecules into Ligation.
The gel image contains what you can see. Exported from Raster or Both, the smear is in the picture, not just the rectangles — the image is built from the gel itself rather than re-drawn, so what lands on your clipboard is what was on your screen.
A run opened as a tab is a snapshot you can keep. It holds that digest — its lanes, its enzymes, its ladder and the mode it was drawn in — while you carry on changing the panel behind it, so you can put two versions of the same digest side by side and compare them. The tab keeps its own Bands · Raster · Both switch. A run saved in Bands carries no smear to show, so those two options are greyed out there with that reason on them, rather than quietly showing you a mode you did not choose.
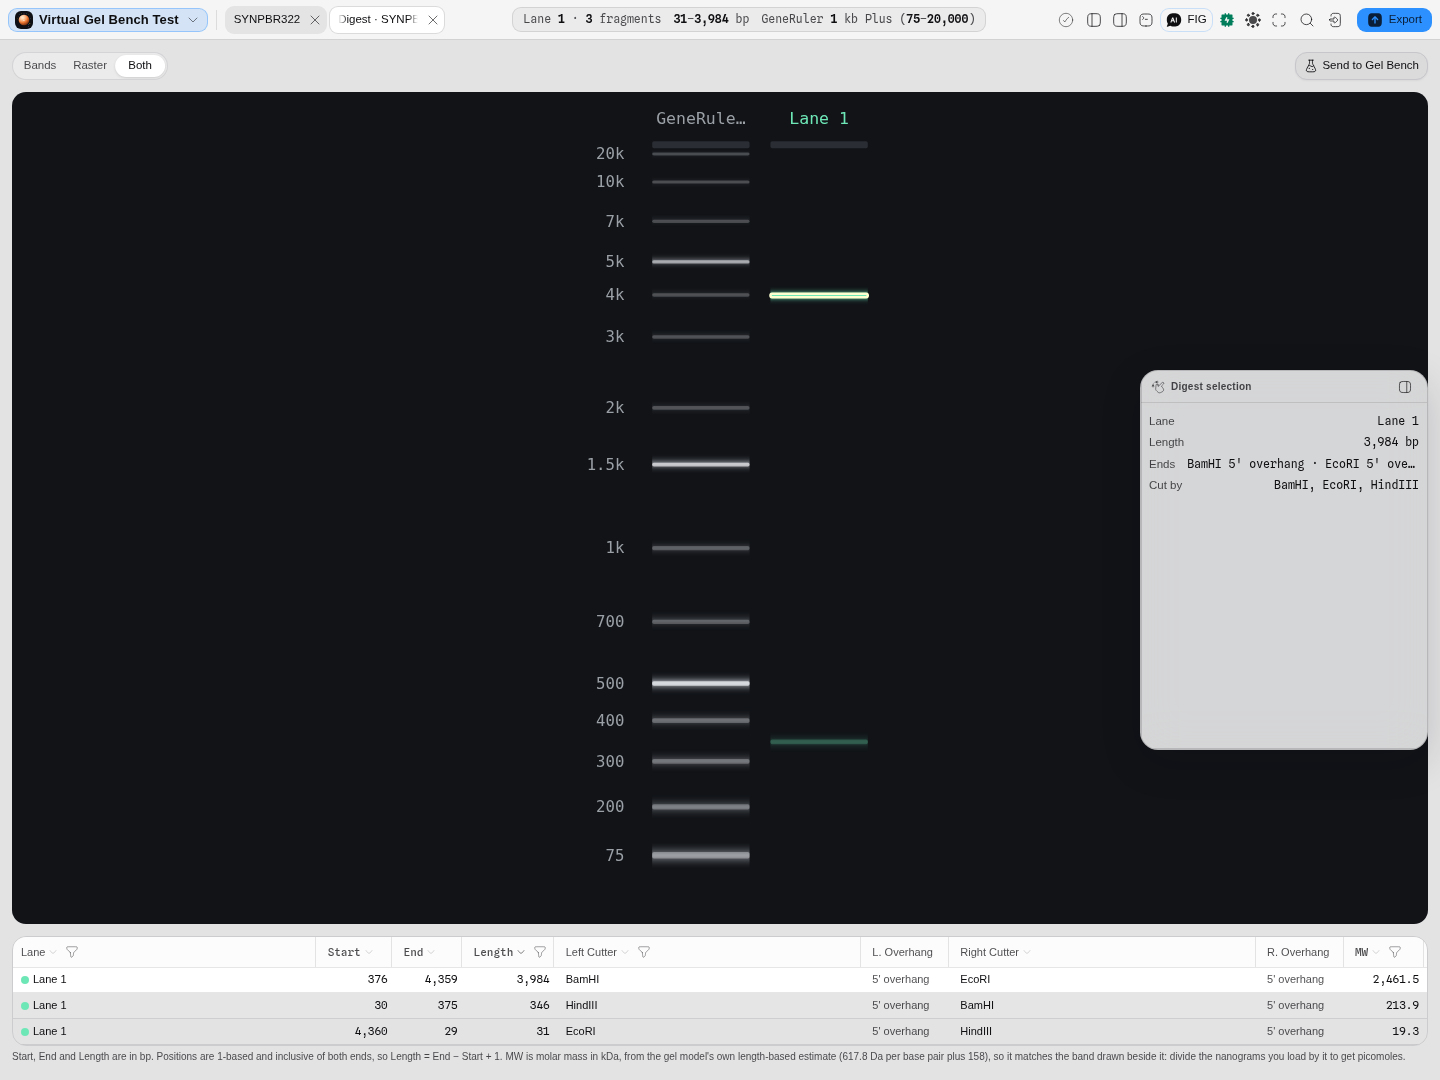 A run reopened as its own tab: pBR322 cut with BamHI + EcoRI + HindIII, the gel filling the stage
above the fragment table's exact coordinates. The tab's own switch is on Both because that is how
the run was made — a saved digest reopens in the render mode it was run in, not in a default. The
3,984 bp fragment is selected here, so its band is lit on the plate and the selection panel names
the enzyme that made each of its two ends.
Related
Feeds it: any loaded record, and fetching it from a database if you are checking a published construct. Follows it: Ligation for what the fragments will join to, Virtual Gel Bench to put this digest beside other samples on one gel. Alternative to: Golden Gate Assembly and Gibson Assembly when you are building rather than checking.
In this group: Ligation · Gibson Assembly · Golden Gate Assembly · Grammar Assembly · Assembly Plan · Recombination Cloning · Site-Directed Mutagenesis · Site-saturation mutagenesis · Multi-site mutagenesis