
Degenerate primers from an alignment
Marked experimental: the surface can change.
Design primers that amplify many templates at once. The input is not a sequence, it is an alignment of the family you want to catch, and the output is the best degenerate oligo at every column of it, under a degeneracy ceiling you choose.
| Reached by | Tools → Primer Designer → Degenerate · command palette → Degenerate primers from an alignment |
| Sample project | Alignment sample — eight orthopteran COI barcodes, aligned when the project opens |
A different question from ordinary primer design
An ordinary designer is given one template and asked for a primer specific to it. Everything it optimises follows from that: uniqueness, no mispriming, a clean single product.
Degenerate design asks the opposite. You have a family — a gene across many species, a virus across its subtypes, an environmental marker across a whole domain of life — and you want one primer pair that binds as many members as possible, including members nobody has sequenced yet. No single sequence will do it, because the family varies at exactly the positions a primer has to sit on.
The answer is a degenerate oligo: a synthesis where certain positions are a mixture of bases
rather than one. Written in IUPAC letters, R means A or G, Y means C or T, N means all four.
ATRCCTATTATAATYG is not one molecule; it is four, synthesised together in one tube.
Reach for it when:
- you are amplifying a gene from a species whose sequence you do not have, using its relatives;
- you are screening an environmental sample where the templates are unknown;
- one assay has to cover a diverse pathogen — HIV-1 group M, influenza segments, SARS-CoV-2 lineages;
- you are barcoding, where the whole point is that the primers work across a clade.
Do not reach for it when you have one template. Degeneracy is a cost, not a feature, and the next section says why.
What this computes
Per alignment column window — the oligo with the best coverage under your degeneracy ceiling, its degeneracy (the product of the per-position ambiguity, i.e. how many distinct molecules the tube holds), how many of the sequences spanning that window it binds, how many distinct sequences exist there, and the column's entropy.
Per oligo, as temperature — a melting-temperature range, never a single number: a degenerate oligo is many molecules with different G+C, so the minimum, the maximum and the spread are reported. The spread is what decides whether one annealing temperature can serve the whole pool.
Per amplifying pair — the product length in alignment columns, and an estimated pair
coverage that is the product of the two oligos' coverages. The panel prints that product explicitly
(7/8 × 8/8 = 88%) with each oligo's degeneracy against the ceiling, and names which half is worth
improving — or says there is nothing to improve when both bind every member. It is an estimate and
is labelled one: the exact figure needs the two windows' per-sequence hit sets intersected, and a
pair whose halves fail on the same members is worse than the product suggests.
Across searches — five of them, because the problem is NP-hard and they answer it differently: the published weighted randomised merging (with its seed on the panel, so a design is reproducible), summation, expansion, constriction, and an exact branch-and-bound that refuses a window it cannot solve rather than returning a guess dressed as an optimum.
What is not computed — whether the family you aligned is the family you will meet. Coverage is measured against the sequences you gave it, and a degenerate primer's real question is what it does to the members you have not sampled.
Degeneracy is the budget, and it is multiplicative
The degeneracy of an oligo is how many distinct molecules the synthesis makes: multiply the
number of bases at each position. One R doubles it. An N quadruples it. Twelve positions left
free is over sixteen million molecules.
That matters because the concentration you order is split across every variant. At degeneracy 4, each of the four is at a quarter of the nominal concentration; at degeneracy 64, well under 2%. Past a point the correct primer for your template is too dilute to prime efficiently, and the wrong ones are numerous enough to mis-prime. High degeneracy also flattens the melting temperature spread, because the variants differ in G+C.
So the design is a constrained optimisation: maximise how many family members the oligo binds, subject to a ceiling on how many molecules it is. That is what the Max degeneracy control sets, and it is the single most consequential number on the panel. Common practice is to stay at or below 64 for a routine assay, and lower where you can.
One thing surprises people the first time: a ceiling has to be a product of 1, 2, 3 and 4, since those are the only counts a position can contribute. Ask for 10 and you get 9; ask for 5 and you get 4. The panel lowers it and says so rather than silently applying a number it cannot honour.
Step by step
1 · Align the family
Open the sequences and align them. The alignment is not a convenience here, it is the input: it is what tells the designer which columns are conserved and which vary, and a wrong alignment produces a confidently wrong primer.
The Alignment sample opens eight cricket COI barcodes already aligned, which is the well-behaved case. The same project also carries nineteen HIV-1 env genes across the group-M subtypes, which is the hard one — align those and the degeneracy needed climbs sharply, which is exactly the real lesson.
2 · Decide which columns are even eligible
Real alignments have sparse columns — positions where most members have a gap because one sequence carried an insertion, or because a few records are short. A primer designed across one of those binds almost nothing.
Min occupancy drops any column that fewer than that fraction of sequences occupy. At 0.9, a column needs 90% of the family present. Raise it for a tight design; lower it if your set has ragged ends and you are losing real signal.
This step does something else you cannot see, and it is the reason the two steps are separate: when it drops a column, it marks the surviving base beside it so the search knows an insertion sat there. That is how an indel is kept out of a primer rather than silently spliced through.
Skip at each end excludes bases at the start and end of every sequence, where coverage is thin and sequencing quality is worst.
A warning worth taking seriously: if your family contains a few much shorter records, a high occupancy can leave no eligible columns at all. The panel says so plainly rather than designing against nothing. The fix is to lower the occupancy or drop the short records.
3 · Choose the search
Finding the maximum-coverage degenerate oligo is NP-hard, so there is no single right algorithm, and this is one of the places where more than one answer is genuinely useful.
| Method | What it does | When it is the right pick |
|---|---|---|
| Weighted randomised merging | Repeatedly draws a sequence at random, weighted by how many templates carry it, and merges it while the ceiling allows; keeps the best of many restarts | The default, and the best all-round choice. It finds rare variants that merge for free — ones that differ only where the oligo is already degenerate |
| Summation | Merges the commonest sequences in order, stopping at the first that would break the ceiling | Fast and deterministic. Blind to that free-merge case, so it usually covers slightly less |
| Expansion | Starts from the commonest base everywhere and spends the budget where the next base is commonest | Deterministic, and reasons per position rather than per sequence |
| Constriction | Starts from every observed base and gives back the rarest until the ceiling is met | Deterministic, and reaches a different answer from Expansion on skewed columns |
| Exact | The true optimum, by branch and bound | When you want to know the best possible, and to check what the heuristics cost you |
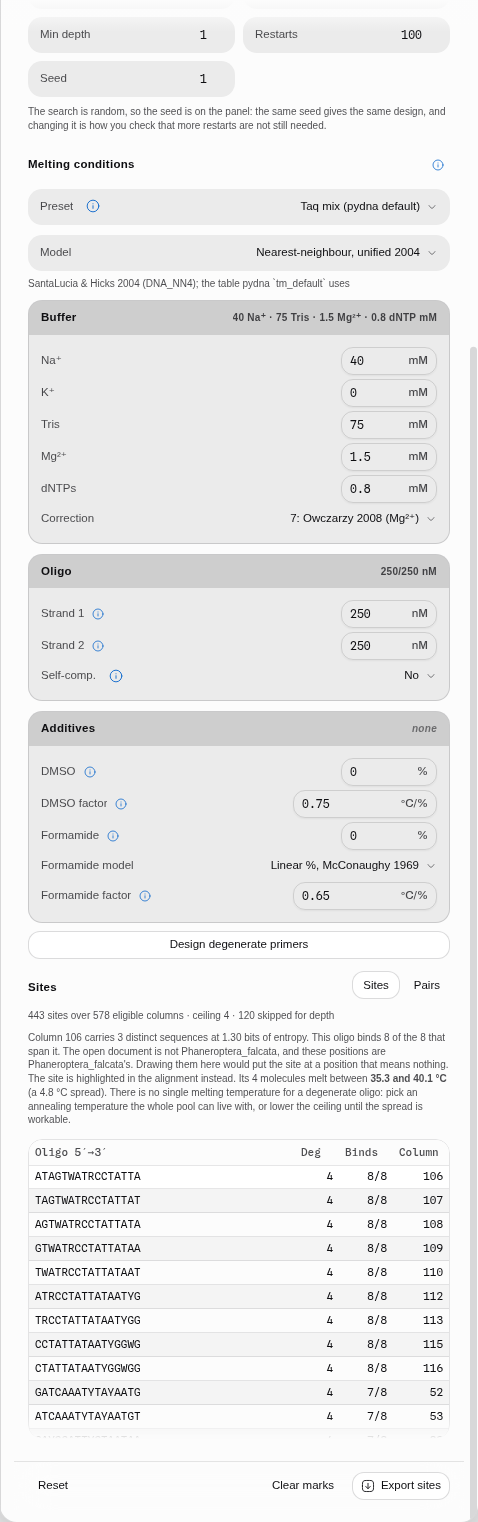
Oligo length sets how many bases each designed oligo spans, and Max degeneracy its ceiling.
The search is random, so the seed is on the panel. The same seed gives the same design, which is what makes a result reproducible; changing it and getting the same answer is how you check that more restarts are not still needed.
Exact refuses windows with more distinct sequences than its limit rather than returning a guess dressed up as an optimum. On a family of a few dozen it usually answers everywhere; on hundreds of sequences it will decline, and that refusal is the honest answer.
4 · Read the sites
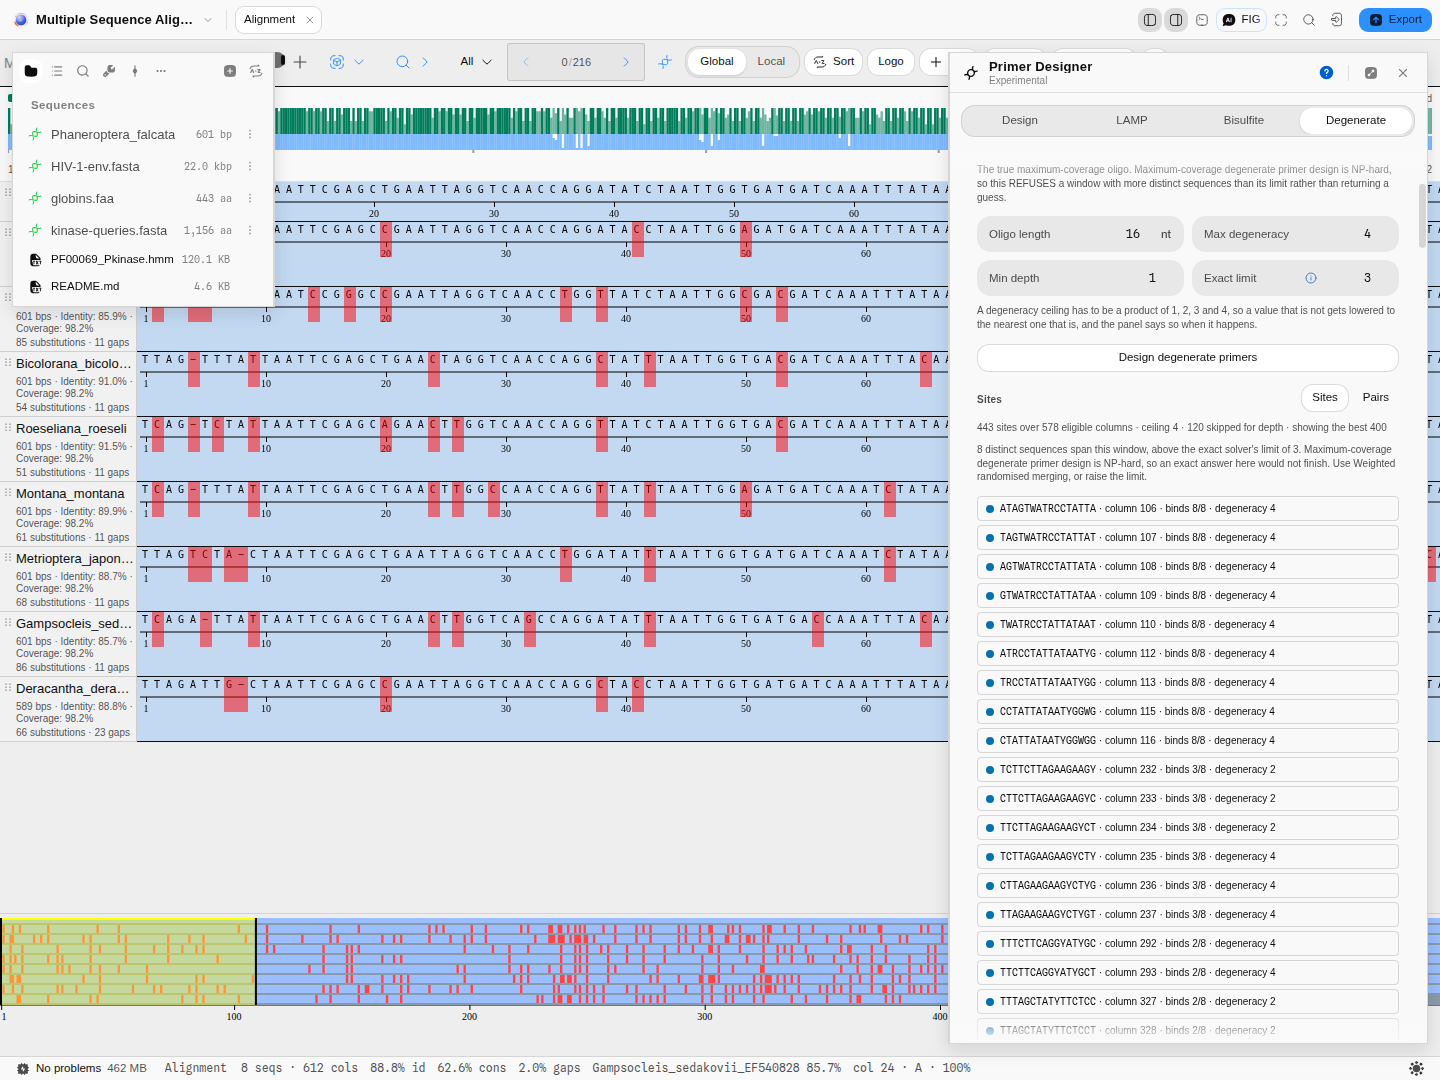
Every eligible column gets a row: the oligo in IUPAC letters, how many of the spanning sequences it binds, and its degeneracy. The list is ranked by coverage.
Two numbers next to each site are worth understanding:
- Distinct sequences — how many different k-mers appear at that column across the family. One means perfectly conserved and a plain oligo will do. Many means you are paying degeneracy here.
- Entropy, in bits — how the family's variation is distributed. Low entropy with several distinct sequences means one variant dominates and the others are rare, which is often a column worth spending budget on. High entropy means the family is genuinely split.
Selecting a site highlights its column in the alignment, so you can look at the variation the number is summarising.
5 · Pair them into an assay
A site is half an assay. The Pairs view combines forward and reverse sites into products inside a size window, ranked by estimated coverage.
Expect to find none the first time, and read what it tells you. Three settings decide whether a pair exists at all: the smallest product you will accept, the largest, and the coverage floor each half has to clear on its own. On the cricket barcodes at the defaults the answer is zero pairs, and the reason is not the one most people guess: 32 of the 443 sites clear an 80% coverage floor, but every one of them sits between columns 52 and 200, so the widest amplicon they could possibly make is 164 columns — well under a 300 bp minimum. No amount of re-running finds a pair; the minimum has to come down, or the floor does.
The panel works that out from the scan and says which of the three is binding, with the number to beat. It is worth trusting over intuition, because the binding constraint changes with the family: on a well-conserved locus it is usually the product window, on a divergent one the coverage floor, and on a short alignment neither — there simply are not two eligible sites.
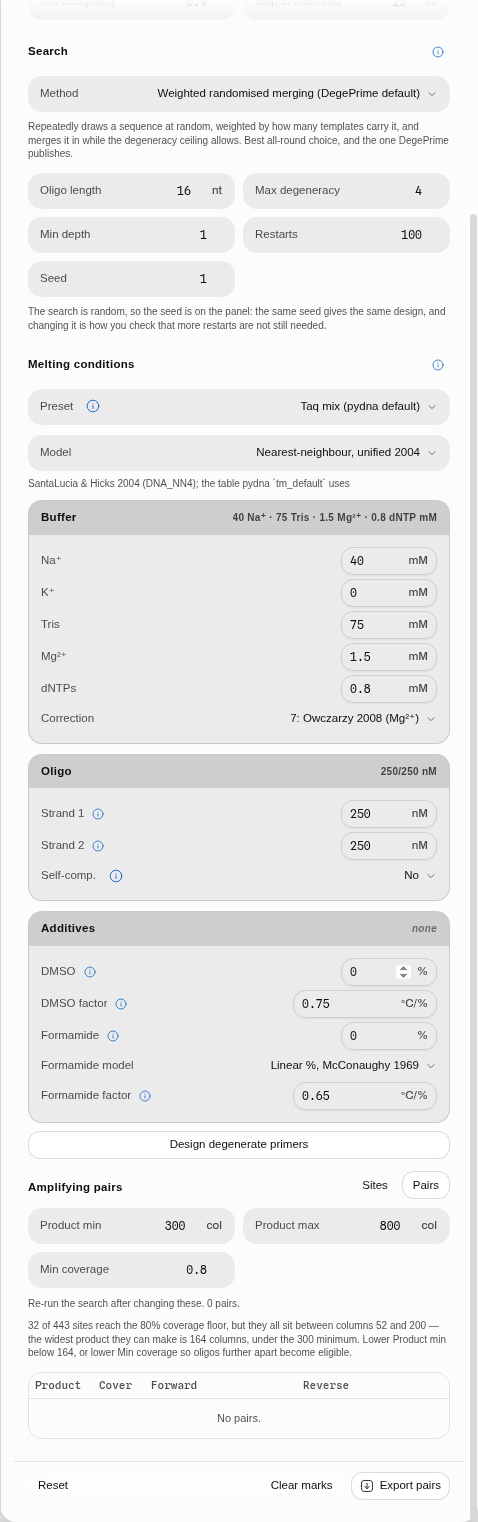
Take its advice and the pairs appear.
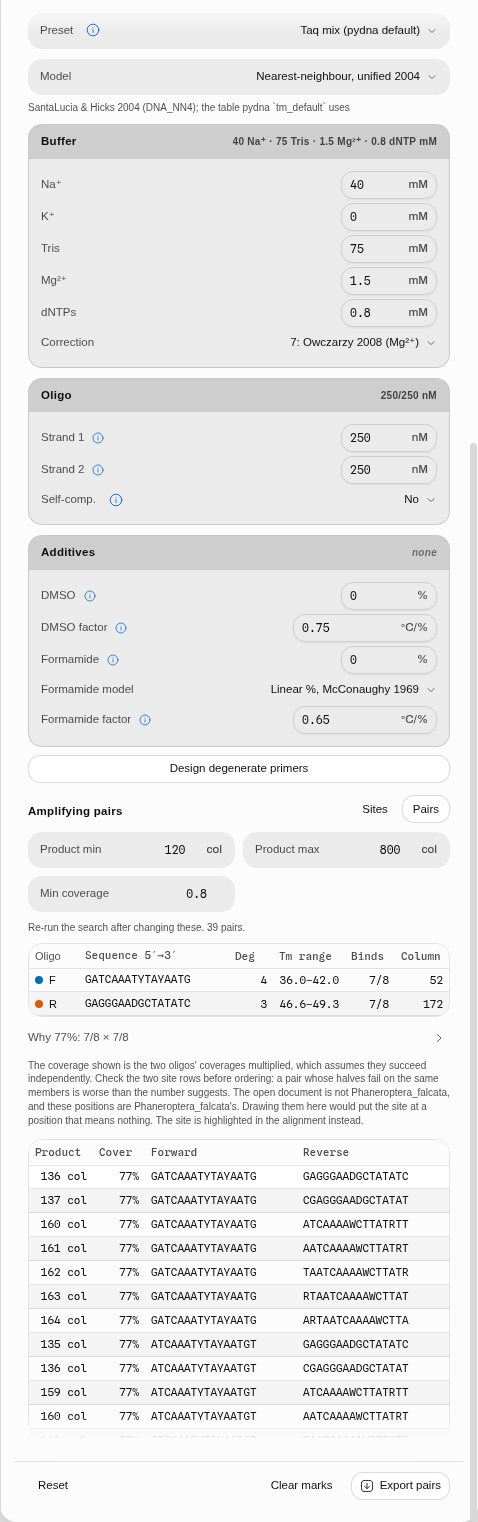
The reverse oligo is shown as you would order it, reverse-complemented, while the site row shows it as it appears on the top strand of the alignment. They are the same oligo written two ways, and mixing them up is the classic ordering mistake.
Read the estimated pair coverage with the caveat the panel states: it is the two oligos' coverages multiplied, which assumes they succeed independently. Check the two site rows before ordering. A pair whose halves both fail on the same three species is much worse than the number suggests, and a pair whose failures are on different members may be better.
6 · See it on the sequence
Selecting a site or a pair draws it on the map of the reference row you pick.
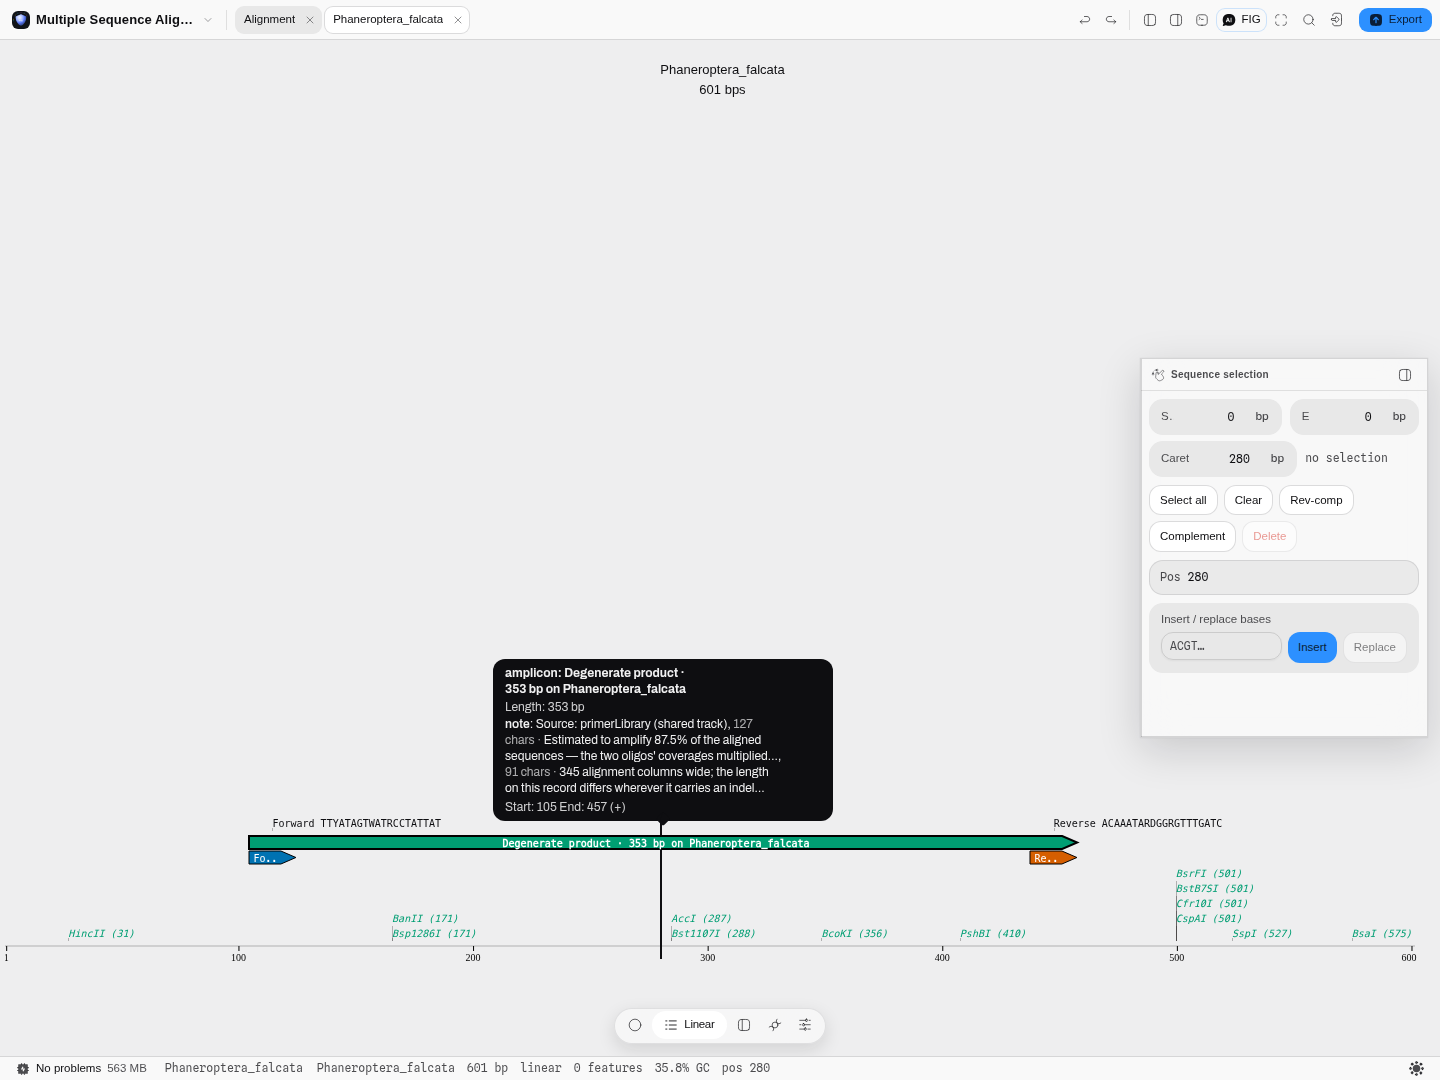
Note what the tooltip says: the product is 353 bp on that record while being 345 alignment columns wide. That difference is that record's own insertions and deletions, and it is why the tool asks which row to draw on. A column of an alignment is a different base number in every sequence.
If the record you chose has a gap under the oligo, nothing is drawn and the panel says so — that member simply does not have those bases, and drawing something anyway would be a fiction.
Pitfalls
A primer that binds every sequence in your alignment is not a primer that binds the family. It binds the members you happened to align. If your set is eight sequences from one genus, the design is honest about those eight and says nothing about the ninth. Align widely.
Degeneracy at the 3′ end is the expensive kind. A mismatch there stops extension; a mismatch in the middle often does not. Where two sites have similar coverage, prefer the one whose degenerate positions sit further from the 3′ end.
A high occupancy cutoff quietly narrows the family. Every column it drops is a column no primer can be designed on. If the eligible-column count falls far below the alignment width, look at what is being excluded before accepting the result.
Coverage is measured against the alignment, not against nature. The percentages are exact statements about your input set. They are estimates about anything else, and the more diverse your family, the more they are estimates.
What it hands to and takes from other tools
- From the alignment tool — the family itself. Align, then design across it; nothing is re-entered.
- To the alignment canvas — selecting a site highlights its column, so the variation behind a number is one glance away.
- To the sequence map — the product and both oligos are drawn on the reference row you choose, on the shared predictions track.
- Out as TSV — the site table and the pair table, with the same columns the published method prints, so a result can be taken elsewhere.
Where the correctness comes from
The window census, the occupancy trim and the coverage counting reproduce the published DegePrime method (Hugerth et al., Applied and Environmental Microbiology, 2014) and are checked against that program's own output — every window of two real alignments at four parameter settings, several thousand rows, asserted position by position.
The search itself is randomised in the original, so it cannot be compared byte for byte against anything, including a second run of itself. It is held to a stricter standard instead: at every one of those windows our search must cover at least as many sequences as the published program did, and where the exact solver can answer, both are checked against the true optimum rather than against each other.
Related
In this group: Primer Designer · LAMP primer set · Bisulfite methylation primers · CODEHOP hybrid primers from a protein alignment · Primer Library · PCR Simulation · Fusion PCR · Multiplex PCR · qPCR Design · Digital PCR · Amplification Curves → Cq · Melt Curves → Tm · Droplet gating → concentration · Droplet classification · Melting Temperature
Bisulfite primer design
Find the CpG islands in a sequence, then design the primers that read methylation in one: BSP for sequencing both alleles, MSP for a band that is itself the answer.
CODEHOP hybrid primers from a protein alignment
Amplify homologues whose DNA no longer aligns: a 3-prime degenerate core over three or four conserved amino acids, fused to a 5-prime consensus clamp back-translated through the codon usage of the organism you are amplifying from.