
Droplet gating
Classify raw droplet amplitudes into empty and positive, then read the concentration.
| Reached by | Tools → qPCR → Droplets |
| Sample project | qPCR & digital PCR |
What it does
A two-channel droplet reader does not hand you a count. It hands you a fluorescence pair for every droplet it measured — tens of thousands of rows per well — and something has to decide which of those droplets held template and which held nothing. The instrument's own software makes that decision and reports the count. This makes it in front of you, from the amplitudes, so you can see where the line was drawn and move it.
The decision is four steps, and the order is part of the method because each one changes what the next one sees.
Is this well usable at all? Two clusters are fitted to the raw droplets. A well fails when its two clusters sit closer to each other than the nearer one sits to the origin — they are one population, not two, and the run did not separate. It also fails when almost every droplet is empty, because there is then no positive population to quantify, and when almost none is, because the empty cluster is too small to be the empty population. Each of those is a different sentence, and the tool tells you which one applied.
Which droplets are junk? The brightest slice of droplets, pooled across the wells that passed, sets one cutoff per channel for the whole plate: the third quartile of that slice plus a number of interquartile ranges. Droplets above it are set aside before anything is fitted. Pooling is deliberate — a per-well cutoff would let one bright well define its own normal.
Where does empty end? Each well's remaining droplets are fitted, per channel, with a mixture of two normal distributions: the empty population and everything else. The cutoff goes a number of standard deviations above the lower component's mean. A droplet below the cutoff in both channels is empty.
What concentration does that imply? The empty fraction inverts through the Poisson zero term. A droplet that received two molecules looks exactly like one that received one, so the count of positives is not the answer; the count of negatives is, because a negative droplet can only mean one that received nothing.
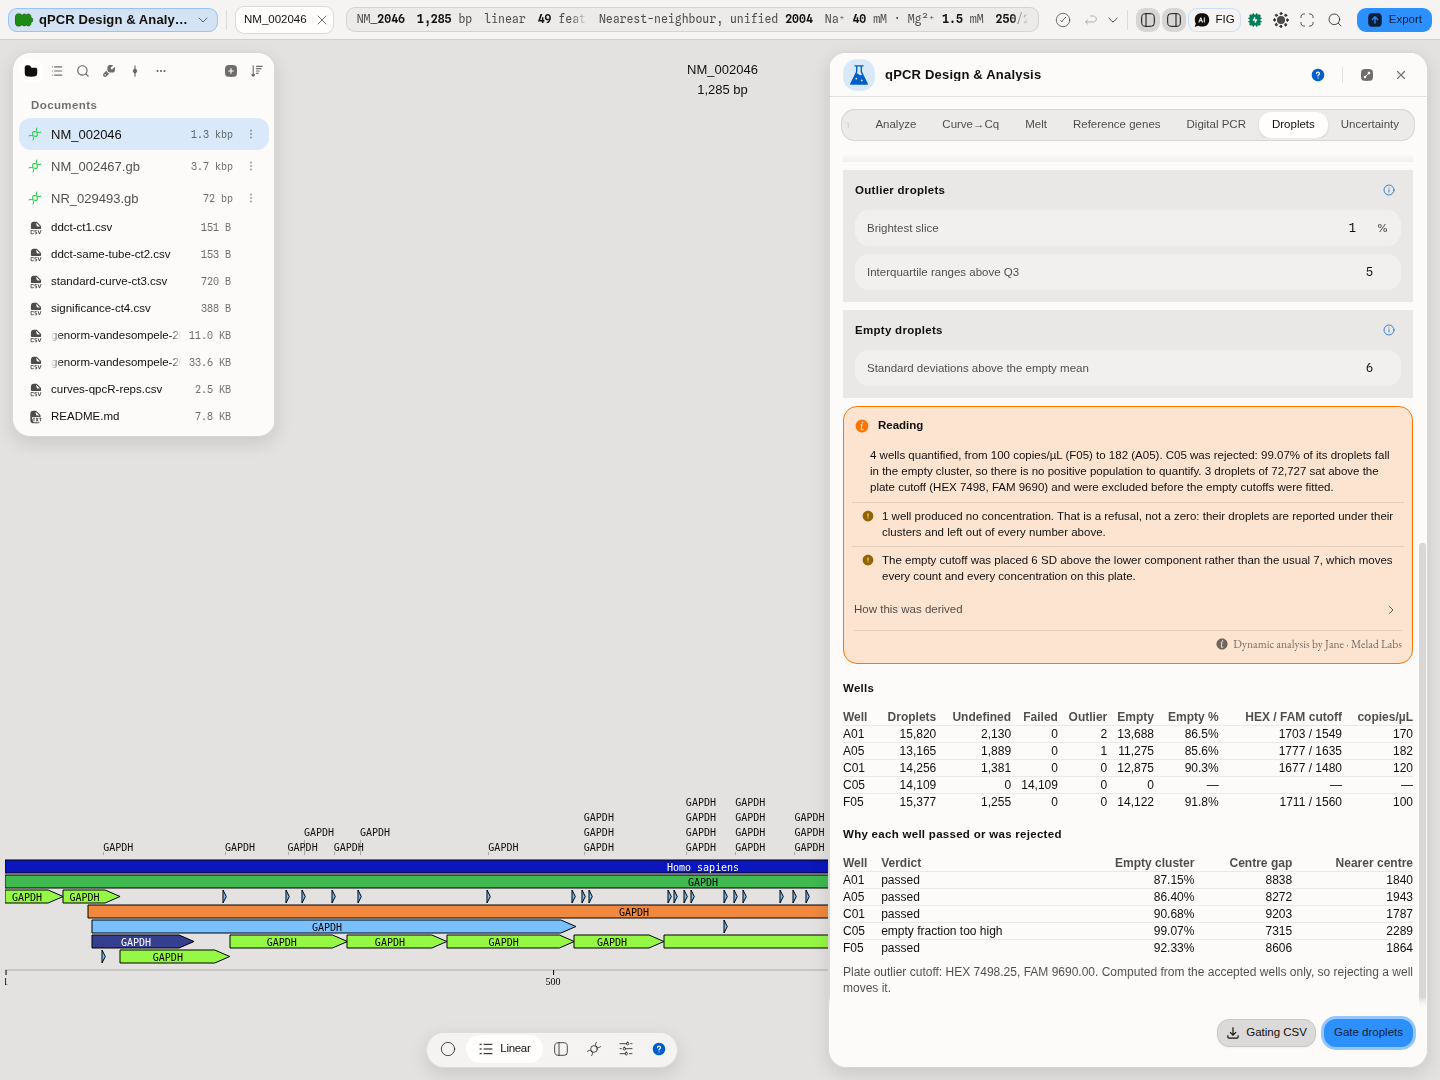
Five real wells from a Bio-Rad QX200: 72,727 droplets classified, four quantified, and one rejected with the number that rejected it.
What this computes
Per well
- a usability verdict, and the check that produced it: clusters not separable, too few droplets, empty fraction below the floor, or empty fraction above the ceiling
- the cluster fit the verdict was taken from — both cluster centres, how many droplets each holds, each centre's distance from the origin, and the gap between them. The verdict is a comparison between two of those numbers, and both are shown, so the verdict can be checked rather than taken
- the empty-droplet cutoff in each channel, as the fluorescence value it actually is
- a full droplet accounting: how many droplets ended in each class — unclassified, in a failed well, outlier, empty — summing to the number read
- the empty fraction, and the concentration in copies per microlitre derived from it
Per plate
- one outlier cutoff per channel, computed from the accepted wells pooled together, so rejecting a well moves it — which is why it is reported rather than assumed
Not computed, and reported as absent
- a rejected well has no empty fraction, no cutoff and no concentration. Those cells are empty rather than zero: a well whose droplets were never classified has not been measured to be zero, and a zero would read as a measurement
When you'd use this
When you have the amplitude export rather than a summary, and you want to see or change the call. Three cases where it matters:
- the instrument rejected a well you think is fine, or accepted one you do not trust. The verdict here comes with the numbers behind it, so you can tell a genuinely merged pair of clusters from a threshold that was one step too strict
- rain. Droplets between the two populations — partial amplification, late starts, damaged template — are exactly the ones a fixed threshold assigns arbitrarily. Moving the cutoff and watching the count move tells you how much of your answer rests on that choice
- two runs that were gated differently. Concentrations from plates whose empty cutoffs disagree are less comparable than they look, and the cutoffs are printed so you can see whether they do
Where it lives
Tools → qPCR opens the qPCR panel; the Droplets tab holds this. It works on the exported amplitudes rather than on the sequence you have open, so it neither needs nor touches the document on the stage.
Inputs and outputs
In: one amplitude export per well, as the reader writes them — two amplitude columns and a cluster column. The well identifier is in the file name, not in the file, which is why each export is given with its name and why a body pasted on its own is refused rather than guessed at.
Out: one row per well, carrying the droplet accounting, the per-well cutoffs and the concentration, as a CSV. A rejected well is in that file with empty cells where its numbers would be, not with zeros.
What it refuses, and says so. A file whose first column is not an amplitude — the reader also writes a target-value summary under a very similar name — is refused by name, because reading it would produce a plate of nothing and a concentration to go with it. A droplet volume of zero, a seed that is not a positive whole number, and a lowest empty fraction at or above the highest are each named before the run: that last one would otherwise reject every well whatever its data, and read as a plate where nothing worked.
Controls
Every step's parameters are yours, and each one moves the answer.
- X and Y channel names — labels for the two channels, so the readouts say HEX and FAM rather than "channel 1". X is the export's second amplitude column and Y is its first, which is the order the reader writes them in and the order every cutoff is computed in.
- Droplet volume — the platform constant that turns an empty fraction into a concentration. 0.85 nL is the Bio-Rad QX100/QX200 droplet; set your own platform's figure.
- Random seed — neither the cluster fit nor the mixture fit has a deterministic starting point, so the seed is part of the answer rather than a convenience. It is re-applied before every fit, which is what makes a re-run reproduce rather than merely resemble.
- Fewest droplets — below this a well is rejected before it is clustered at all.
- Lowest and highest empty fraction — the band a usable well's empty cluster must fall in.
- Brightest slice and interquartile ranges above Q3 — the outlier cutoff. A larger slice makes the cutoff less sensitive to a handful of very bright droplets.
- Standard deviations above the empty mean — the one that decides the concentration. Lower it and fewer droplets are called empty, so the concentration rises.
The science
The Poisson step is the same one absolute quantification rests on: with λ copies per droplet, the chance a droplet receives none is e^−λ, so the empty fraction is e^−λ and λ = −ln(empty fraction). Dividing by the droplet volume gives copies per microlitre. What droplet gating adds is that the empty fraction is itself an estimate here, not a count handed over by the instrument — so the threshold that produced it is a parameter of the result, and is reported with it.
The mixture fit is expectation-maximisation on a two-component normal mixture, run per well and per channel. It is fitted rather than thresholded because the empty population's width varies between wells, and a cutoff placed a fixed number of fluorescence units above a fixed point would be strict on a tight well and loose on a broad one. Placing it a number of standard deviations above the fitted empty mean adapts to the well.
Correctness is checked against the published open-source implementation of this method, well for well, on its own droplet exports: the same cluster fits, the same cutoffs, the same droplet in the same class, and the same concentration.
Limitations
- Two channels, two populations. The mixture fitted per channel has two components, so this answers the two-target question. Reactions carrying three or four targets produce more clusters than that, and published methods exist for them; this is not one of them, and it will not pretend otherwise on your data — it will classify a four-target well into two populations and the answer will be wrong rather than absent.
- One classification method on this page. The empty cutoff here is fitted as a mixture, per channel. Three other published methods classify the same droplets a different way and are on the Classify tab beside this one; they do not always agree on the droplets in between, and where the call is close that disagreement is the honest measure of how much your answer rests on the method rather than on the data.
- The empty cutoff is per well. That is what makes it adapt, and it is also why two wells on one plate can be gated at different thresholds. When they differ widely the tool says so, because the concentrations are then less directly comparable than they appear.
- Near saturation the inversion is steep. A well with very few empty droplets has a concentration that a handful of droplets either way would move a long way; the tool flags those rather than reporting the number alone.
- A rejected well is rejected, not zero. Nothing downstream fills it in.
Compared with other tools
Classify takes the same amplitudes and asks a different question: not "is this droplet empty" per channel, but which of four populations — neither target, one, the other, or both — it belongs to, jointly over both channels. That is where a linkage or copy-number read starts. It offers three methods, one of which can decline to call a droplet at all.
Digital PCR starts one step later: it takes the positive and valid partition counts the instrument already produced and quantifies them, with a choice of eleven confidence-interval methods and a partition-volume-variance correction. Use it when you have counts. Use droplet gating when you have amplitudes and the classification is the thing in question — then take its counts onward if you want a different interval on them.
Melt Curves → Tm
Read the dissociation curves and find out whether you amplified one product or several.
Droplet classification
Sort droplets into their populations: two targets under three methods that disagree, or up to four targets by density, spectral clustering, flow peaks or the consensus of all three.