
Variant table
| Document kind | variants |
| Drawn from | a file — it can also be previewed in the file manager |
| Formats that open here | VCF · BCF |
| Refuses to draw below | 260px wide |
What it draws
A VCF as the variant table it is, rather than the lines it was written as — with two more views beside it, because one table cannot answer the three questions a VCF is opened to answer:
- Variants — the records, one row each, with INFO fields and per-sample genotype columns you can switch on.
- Summary — counts by variant type, the transition/transversion ratio, the substitution breakdown, indel lengths, and the per-contig and per-FILTER tallies.
- Samples — per-sample genotype counts, which is where a bad sample shows up as a number rather than as a hunch.
What opens in it
VCF, plain or compressed, and BCF — the binary encoding of the same data, which opens as the same table with the same views, filters and exports. The only visible difference is that the region control is switched off for a BCF, because reading one locus relies on an index that addresses text records rather than binary ones; the file is read whole instead, and the control says so.
A compressed VCF with a tabix index (.tbi/.csi) alongside it can be
read one locus at a time, straight out of the compressed file, instead of being read whole — which
is what makes a whole-genome callset usable. Without an index the file is read whole, and that is
stated rather than silently slow.
A file whose index cannot be read keeps the region control visible but disabled, with the real reason on it, instead of quietly losing the feature.
What this computes
The calls are the caller's; the file is read as written. What this canvas computes is everything in the two views beside the record table, and the counts are meant to match the tool you would otherwise reach for.
- Allele type per record, classified by htslib's own rule — the rule
bcftoolsapplies — so these counts matchbcftools statson the same file. One consequence looks like a bug and is not: a site can be both an SNV and an indel when its ALT list carries both kinds, so type counts do not sum to the record count. - Counts by variant type over whatever is currently in view, so a filter changes the summary rather than leaving it describing a file you are no longer looking at.
- Transition/transversion ratio (Ts/Tv) — a sanity check on a callset, never a score on a record. Whole-genome human callsets sit near 2.0 and exomes nearer 3.0; a value far from what your experiment should give is a sign of false positives and says nothing about any individual variant.
- The substitution breakdown, each of the six base-change classes counted separately, which is where a skew that Ts/Tv averages away becomes visible.
- Indel length distribution, insertions and deletions distinguished by sign rather than merged.
- Per-contig and per-FILTER tallies — the second being how you look at what the caller rejected rather than only past it, since by default you are shown everything, rejected records included.
- Per-sample genotype counts, which is where a bad sample stops being a hunch and becomes a number.
- Missing QUAL as distinct from QUAL 0. Setting a minimum QUAL hides records that carry none, because there is nothing to compare — with a switch to keep them, since a caller that never writes QUAL would otherwise appear to have found nothing at all.
- Whether the call set belongs to the open sequence, before any call is drawn on its map: every REF allele in range must be the sequence's own bases at that position. A one-base REF matches an unrelated sequence about one time in four, so agreement call by call proves nothing; one disagreement keeps the whole set off the map, and the reading says how many agreed and how many did not.
Positions are 1-based, as the VCF specification defines them.
Reading it
- Positions are 1-based, as the VCF specification defines them.
- Allele types are classified by htslib's own rule — the same rule
bcftoolsapplies — so the counts here match the numbers you would get frombcftools statson the same file. One consequence is worth knowing because it looks like a bug: a site can be both an SNV and an indel, when its ALT list contains both kinds, so type counts do not sum to the record count. - A FILTER other than PASS means the caller rejected the record, and by default you are looking at everything, rejected records included. The FILTER control is how you look at what was rejected rather than only past it.
- A record with no QUAL is not a record with QUAL 0. Setting a minimum QUAL hides records that record none, because there is nothing to compare — with a switch to keep them, since a caller that never writes QUAL would otherwise appear to have found nothing.
- Ts/Tv is a sanity check, not a score. Whole-genome human callsets sit near 2.0 and exomes nearer 3.0; a value far from what your experiment should give is a sign of false positives, and it says nothing about any individual record.
Controls
| Control | What it does |
|---|---|
| Region | Reads one locus out of an indexed compressed file rather than all of it. Clear the field to go back to the whole file. Disabled, with the reason shown, when there is no readable index. |
| View | Variants · Summary · Samples. |
| Contig | Restricts the table to one contig; each option carries its record count. |
| Type | All · SNVs · Indels · MNVs · Symbolic/SV · Breakends · Spanning deletions. |
| PASS only | Hides records carrying any FILTER other than PASS. |
| Min QUAL | A quality floor, with Keep QUAL-less beside it for the case above. |
| Multiallelic only | Records with more than one ALT allele. |
| FILTER | Keep only records carrying one specific FILTER id — each option carries its count and the header's own description of it. |
| Columns | INFO and genotype columns start hidden and are switched on individually. A ClinVar VCF declares dozens of INFO fields, and opening with forty columns on is unreadable. |
| Show on map | Draws the rows the table is showing on the open sequence's map, one lollipop per call. On by default. |
| Lollipop height | QUAL (against the highest QUAL drawn) or allele frequency (the record's INFO AF, 0 to 1). A call stating neither is drawn hollow at full height. |
Filtering happens in the engine, not in the table. The same predicate decides what the table shows, what an export writes, and what is drawn on the sequence map — so those three cannot disagree about what you are looking at.
Where it appears
As a stage tab when you open a VCF, and in the file manager preview, with every control available in both.
The stage tab adds what a preview cannot have: editor coupling in both directions. Selecting a row selects those bases on the focused sequence canvas, and the Apply column substitutes an ALT allele into the sequence. An interval that falls outside the sequence is refused with the reason, naming the coordinate offset as the thing to fix, rather than being clamped to something plausible.
The calls on the map. The rows in view are drawn on the sequence's variants lane, a lollipop at
each call: coloured by type (SNV, indel, MNV, breakend, spanning deletion, symbolic), as tall as its
QUAL or allele frequency. Change a filter and the map follows. Hover a call for its alleles, QUAL, AF
and FILTER; click it to select its bases and point the table at its row; double-click it to open the
table at that row. The line under the table's controls, and the panel's On the map, name each
colour with its count and say what the height means. Opened against a sequence the calls were not
made on, the map draws nothing and says why: the Variant calls sample project's sars.gb is
the 2003 virus, and DRR1051020's calls agree with it at 24 of 104 positions, which is chance.
Performance and limits
- Indexed random access is the fast path; without an index the whole file is parsed, and the size it accepts is bounded accordingly.
- The offset control matters. A VCF's coordinates are relative to a reference contig; your open sequence may be a fragment of it. The offset states the relationship (1 meaning "this sequence is the contig"), and a wrong offset is the difference between selecting the right base and a plausible wrong one.
Screenshots
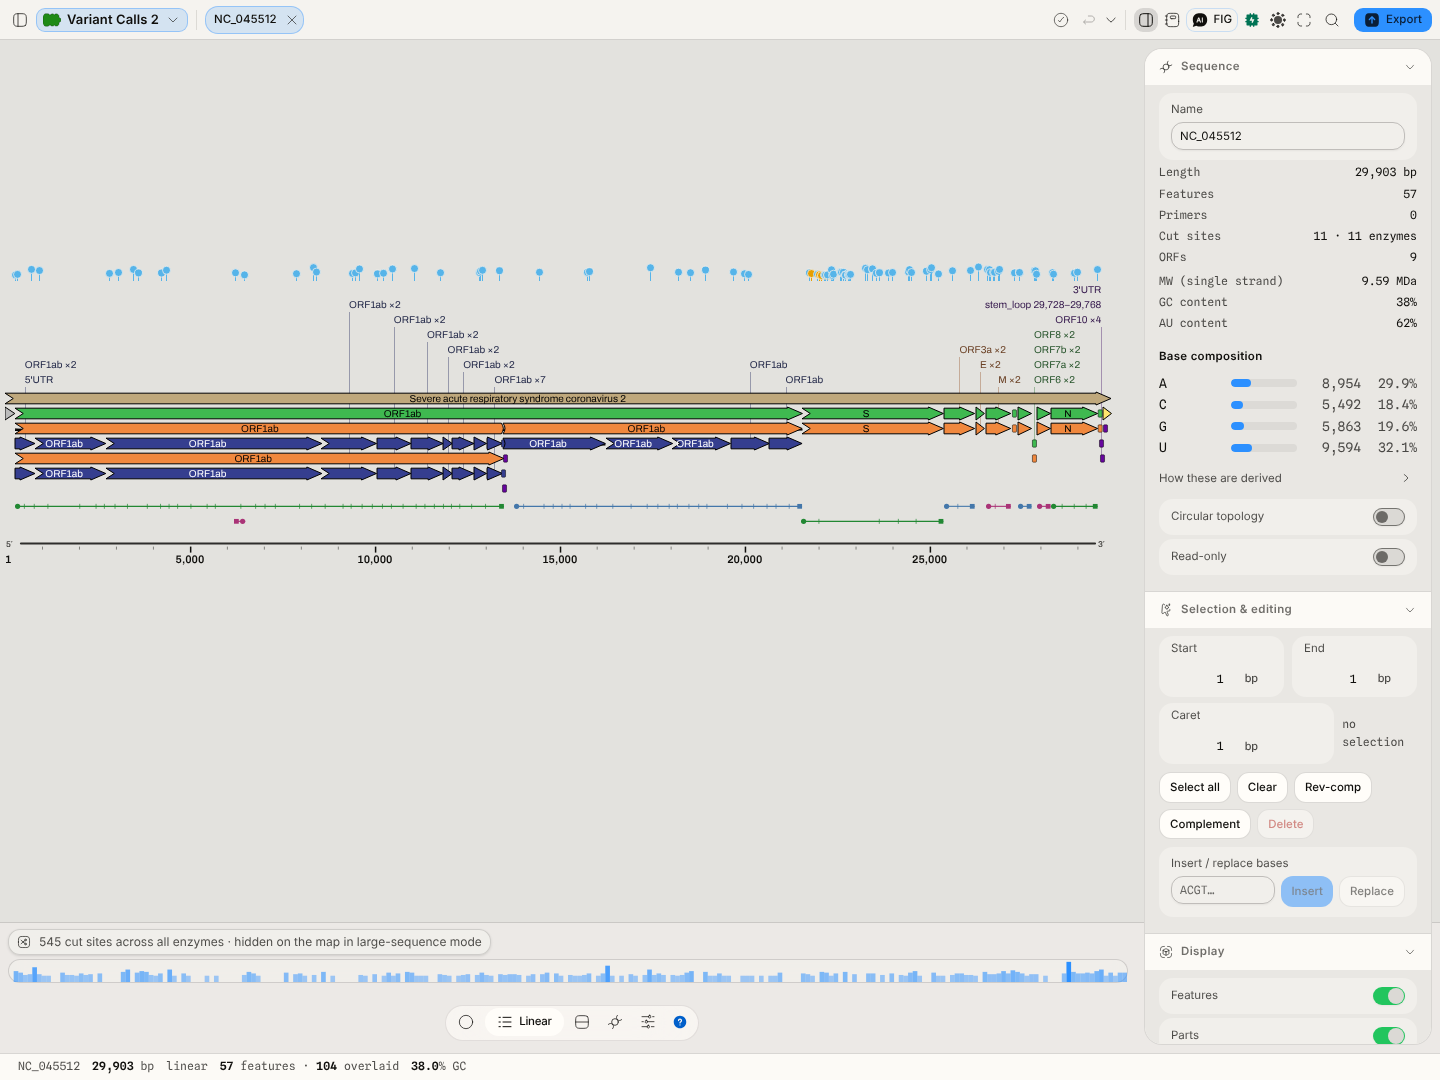
The Variant calls sample project as it opens: NC_045512.2, the SARS-CoV-2 reference, with DRR1051020's 104 calls on its map. The 99 SNVs are blue; the five indels are the orange calls between 21,765 and 22,193, all in the spike gene (S, 21,563–25,384). The tallest head is the highest-QUAL call, 80,950.1.
All three below are the same canvas on 1000genomes.bcf from the Variant calls sample project,
which is two real chromosome-Y sites called across 1,233 individuals.
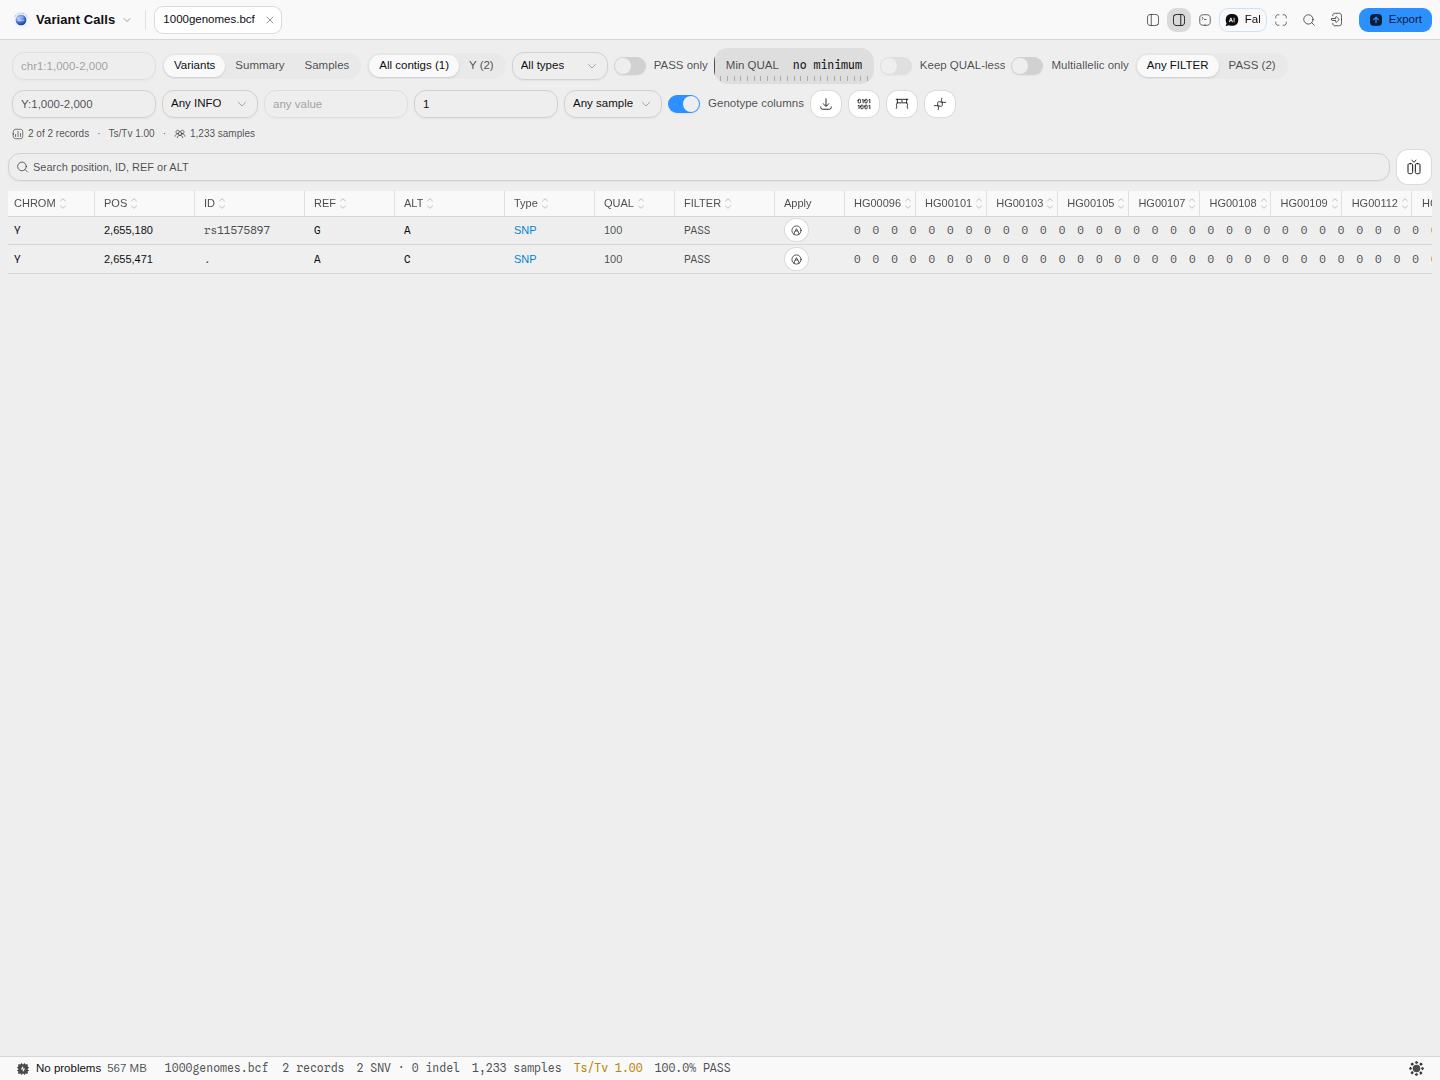
The table with genotype columns on. The columns after Apply are the individuals (HG00096,
HG00101, …); there are 1,233 of them, and they scroll horizontally inside the table rather than
widening the page.
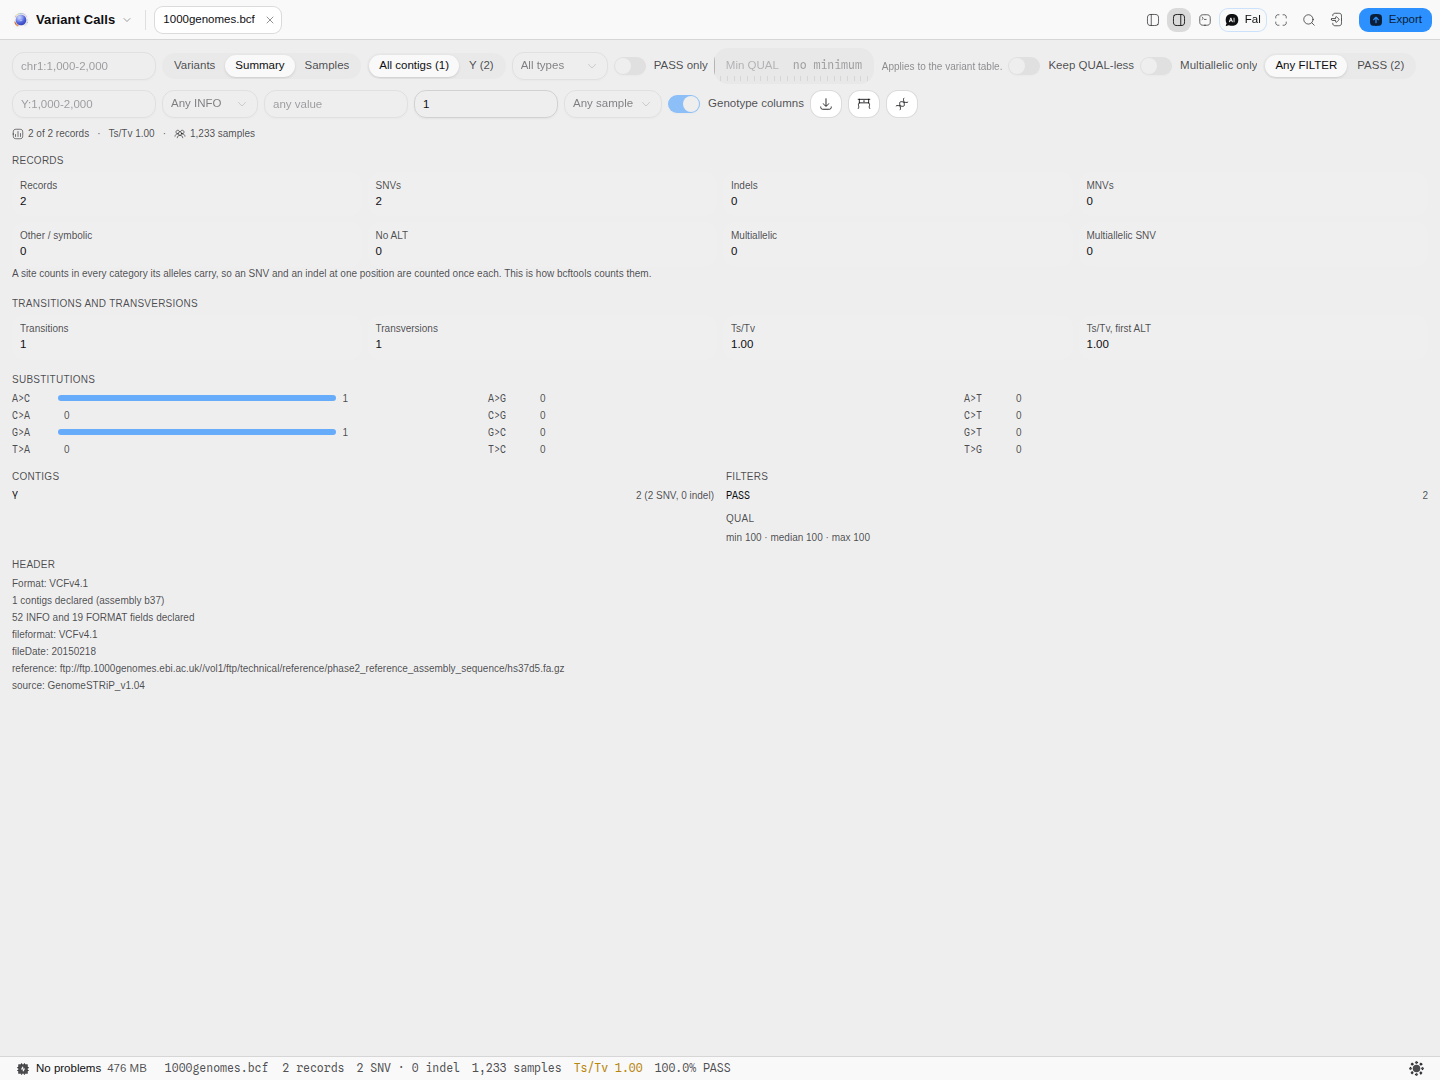
The Summary view. Note Transitions 1 · Transversions 1 · Ts/Tv 1.00 on two records — a ratio is
meaningless at this scale, and it is shown anyway rather than hidden, because the file is what it
is. The Header block at the foot is the file's own: 52 INFO and 19 FORMAT fields declared, and the
reference the caller used.
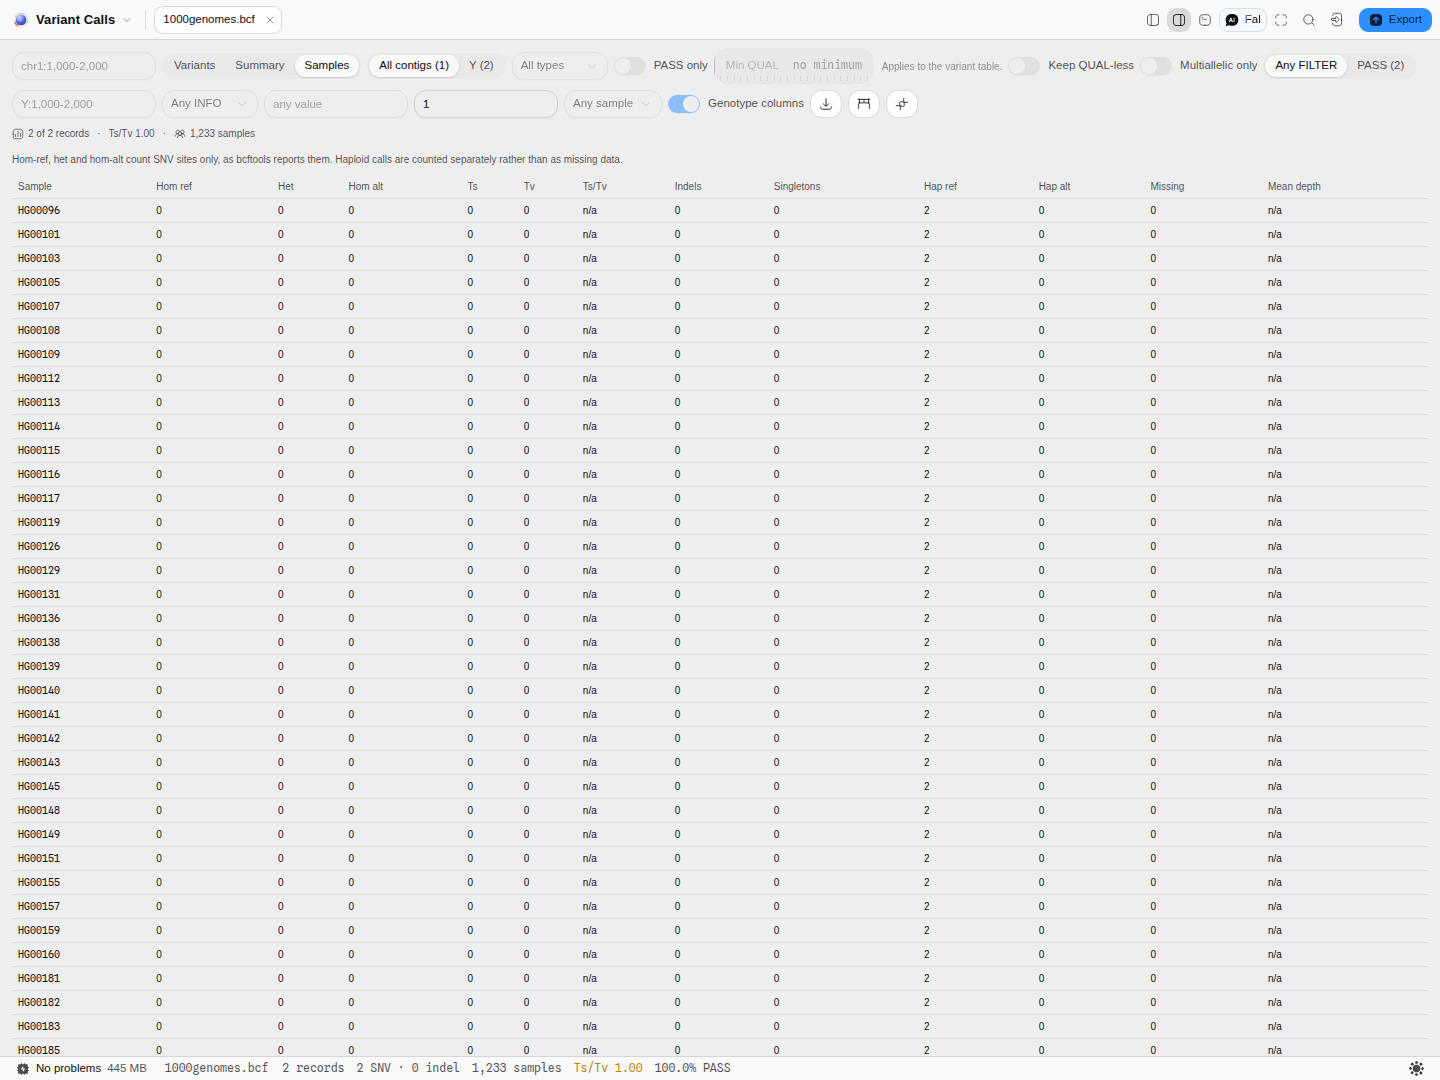
The Samples view. Every individual reads Hap ref 2 — these are chromosome-Y calls, so each is
haploid, and they are counted as haploid rather than as half-missing diploid calls. This is the
distinction described under "Reading it"; a reader that assumes fixed ploidy reports this same file
as 100% missing data.
Related
The Variant calls panel sits beside this table and reads it back to you: the conclusion, how each figure was derived, and what the counts do and do not describe.
The pileup is where you check whether a variant is real — the reads behind it, their strands and their positions. The sequence map is where an applied variant lands.