
Gel
| Document kind | gel |
| Drawn from | a tool result — there is no file behind it |
What it draws
A gel canvas is an agarose run you did not have to pour. It draws one lane per sample, each carrying whatever DNA you put in it, against a molecular-weight reference lane — and the position of every band is computed, not decorated. Two fragments 200 bp apart sit as far apart on this canvas as they would in a tank, because the same migration model places both.
Three things make up the picture.
The reference lane. A marker ladder, drawn with its sizes labelled down the side. It is not a decoration on the edge of the drawing: it is the curve everything else is positioned against. Change the ladder and every band in every lane moves, because the calibration moved.
The sample lanes. Each lane is a set of DNA lengths with a name, a colour and — this is the part most virtual gels do not model — its own topology. A supercoiled plasmid, the same plasmid nicked, and the same plasmid cut once to run linear are three different distances down the gel at one identical base count, which is exactly what you see on a real prep and exactly why "it ran at the wrong size" is usually not a wrong size at all.
The migration itself. Length and topology go into an empirical agarose law, out comes a relative mobility, and that becomes a distance from the well. Nothing is placed by eye.
What opens in it
Nothing opens in it. There is no gel file: a gel is drawn from a run, and the DNA in its lanes gets there in one of four ways.
- The Gel Bench, where you build lanes yourself — from the open molecule, from a digest result, or by typing in lengths.
- A restriction digest, whose Send to Gel Bench hands every lane it produced across with its fragments intact, and with the percentage and mobility law it was run at: an empty bench takes them, and a bench that already holds lanes keeps its own and says what the arriving lane was read at.
- A PCR, a fusion PCR or a multiplex PCR, each of which draws its products on this same gel with these same controls.
What does not open here, though a reader might expect it to: a protein or peptide mass. This canvas models DNA in agarose, in base pairs; there is no SDS-PAGE lane and no kDa marker, and pushing a peptide mass through a DNA mobility law would produce a confident, wrong picture.
What this computes
Every band's position on this canvas is a computed quantity, not a drawn one.
- Relative mobility (Rf) for each fragment, from its length in base pairs and its DNA topology, through an empirical agarose law. This is the number the whole picture is built on: distance from the well is Rf scaled to the plate.
- Two published migration laws, and you choose which runs. The Helling–Goodman–Boyer log-linear law, defined at ten casting percentages (0.5, 0.7, 0.8, 1.0, 1.2, 1.5, 2.0, 2.5, 3.0, 4.0 %); and the Rill / Van Winkle law (Van Winkle, Rill et al., Electrophoresis 23(1), 2002), measured over 0.5–1.3 % agarose. Ask either for a condition outside its measured domain and the canvas substitutes the nearest defined one and says so rather than interpolating silently.
- Topology form factors: supercoiled, open-circular (nicked) and linear DNA of one identical base count migrate to three different distances. This is the effect behind most "it ran at the wrong size" results, and it is modelled rather than ignored.
- Ladder calibration. Ten reference ladders are offered; two of them — GeneRuler 1 kb Plus (75–20,000) and the Hi-Lo DNA Marker (50–10,000) — carry Rf values read off a real gel image band by band, so only those two can calibrate a run. The other eight are size lists, drawn as reference lanes but positioned by whichever measured curve is in force, and the canvas names that curve in its own readout. You can also supply your own Rf calibration from a gel you ran.
- The resolving window for the chosen agarose percentage — the size range that percentage can actually separate (roughly 500 bp – 10 kb at 1 %, 50 bp – 1 kb at 3 %). Fragments outside it are placed by damped extrapolation, counted, and declared as positions rather than measurements.
- Band co-migration: which fragments are too close in size to resolve as separate bands at the chosen percentage, so a doublet is not read as a single band.
- Band intensity, from the DNA mass a lane carries, with the normalisation stated: whole plate scales against the brightest band anywhere (brightness comparable between lanes), per lane scales each lane against its own brightest (every lane legible, between-lane brightness meaningless). The line under the plate names which is in force and travels with the exported image.
Reading it
Distance from the well is the measurement; the band's thickness is not. Band width and intensity are drawn to be legible and to reflect how much DNA a ladder mark carries. Read sizes off the vertical position against the ladder — or, better, off the table beside the gel.
Brightness is relative, and the gel states what to. Whole plate scales every band against the brightest band on the gel, which keeps brightness comparable between lanes and can leave a lightly loaded lane almost black. Per lane scales each lane against its own brightest band, which makes every lane legible and makes between-lane brightness meaningless. The line under the plate names whichever is in force, and it travels with the exported image.
Two of the ten ladders carry measured Rf values; the other eight carry sizes only. GeneRuler 1 kb Plus and the Hi-Lo marker were each read off a real gel image band by band, so they can calibrate the run. The remaining eight are mark lists: they are drawn as reference lanes, but their marks are read off whichever curve is calibrating rather than off a migration of their own. The gel says which curve that was, in the line under it: pick the NEB 100 bp ladder and the readout reads "Positioned by GeneRuler 1 kb Plus (75-20,000)", because that is the ladder whose measured Rf actually placed everything you are looking at.
The resolving window is stated, and it means what it says. Every agarose percentage resolves a band of sizes and no more: 1 % resolves roughly 500 bp – 10 kb, 3 % resolves 50 bp – 1 kb. The panel prints this window under the gel. When some of your fragments fall outside it, it says how many, and those bands are placed by damped extrapolation — their positions are honest but they are not measurements. Read those sizes from the table, not off the gel.
A percentage the law is not defined at is substituted, out loud. The Helling–Goodman–Boyer law is defined at ten casting percentages (0.5, 0.7, 0.8, 1.0, 1.2, 1.5, 2.0, 2.5, 3.0, 4.0). Ask for 1.1 % and the gel says "modelled at 1.2 %, the nearest percentage this law is defined at". Under the Rill/Van Winkle law the disclosure is different because the limit is: it was measured from 0.5–1.3 % agarose, so anything above 1.3 % gives you the crossover measured at 1.3 % — the canvas says so rather than letting a slider imply a change it cannot make.
Two lanes at the same base count can legitimately differ. If they carry different topologies, they should. The form multiplier is applied to effective molecular weight, so supercoiled DNA runs ahead of linear at the same length and nicked DNA runs behind it.
An empty lane is a result, not a failure. A lane whose enzymes cut nothing draws empty and says why. If you find yourself inferring "the run did nothing" from a blank column, read the sentence under it — the canvas will already have told you.
Controls
Every gel surface in the workbench turns the same knobs, because they are declared once and shared.
| Control | What it changes |
|---|---|
| Ladder | Which marker lane is drawn, and — unless you have said otherwise — the curve every band is placed against. Ten real ladders ship: GeneRuler 1 kb Plus, 1 kb, 100 bp and 100 bp Plus, Hi-Lo, Thermo 1 Kb Plus, NEB 1 kb and 100 bp, Lambda/HindIII, and PennState. You can also add your own by typing its mark sizes in. |
| Agarose % | The casting percentage. Ten anchors, plus a Custom percentage… box accepting anything from 0.3 % to 5.0 %. This is the control that decides where every band sits. |
| Model | Which published mobility law runs. Helling–Goodman–Boyer is the default and is the validated one. Rill/Van Winkle is offered as (approx.) and labelled that way for a specific reason, below. |
| Form | The topology of the DNA in this lane — linear, supercoiled, nicked or relaxed. Per lane on the Bench, so one gel can carry all of them. |
| Calibrate | Which (bp, Rf) curve positions the gel. The default is the selected ladder's own. If you measured Rf values off a photograph of your gel, add them with your ladder and the whole canvas repositions onto your run. A ladder with marks but no Rf table is offered as a disabled row carrying that reason, rather than quietly missing. |
| Render mode | Bands draws one measurable rectangle per fragment. Raster draws the camera-like smear, where near-identical fragments merge into one fat band as they do on a photograph. Both overlays them, which is the mode worth using when you want to know whether two bands you can measure are two bands you would actually see. |
Refusals are shown next to the control that caused them. An Rf table that does not decrease as length increases is rejected by naming the two offending marks; a half-annotated table is rejected by counting them ("Give an Rf for every mark or for none — 2 of 3 have one").
What you can take out of it
A gel leaves the workbench two ways, and they answer different questions. The picture is what you put in a figure or a lab notebook; the table is what you sort, filter and hand to whatever comes next. Both are written from the run on screen, under the ladder, percentage, mobility law and form you actually set, so an export can never describe a different gel from the one you are reading.
| What you get | What is in it |
|---|---|
| Figure (SVG) | The plate as drawn, as vector. It scales to any size without softening a band edge, and it carries the ladder marks and lane labels as real text, so a reader can select them. This is the form a journal asks for. |
| Figure (PNG) | The same plate rasterised at twice its on-screen size, for a slide or a document that will not take vector. Twice, not once, because a gel is read by comparing band positions and a screen-resolution copy loses the narrow ones. |
| Fragments (CSV) | One row per fragment: which lane it is in, where it starts and ends on the molecule, how long it is, the enzyme and the overhang at each end, and its mass. This is the table to sort when you want to know which band to cut out of the real gel. |
The picture is the drawing itself, not a screenshot of the window — nothing is lost to the panel chrome around it, and the background is painted white so the figure reads on paper as well as on screen, whichever theme you were working in.
Where it appears
In the Gel Bench panel, in the gel section of the PCR, fusion and multiplex panels, and as its own stage tab when you want the gel beside the map instead of in the rail. It is the same component and the same physics in each; a tab is a persistent snapshot of a run, so it keeps the settings it was run with.
Performance and limits
The gel draws one image per lane rather than hundreds of rectangles, so lane count is cheap and a raster gel exports to PNG with the image inside it rather than as an empty frame. Where ladder marks crowd together (the marks a 1 % gel cannot resolve sit within a few pixels of each other), every mark still gets its own label: the labels spread into the free space beside the crowd, in size order, each joined to its band by a short line. Only a plate too short to give each mark a row folds the closest marks into a range, and hovering a band always names its size.
The real limit is scientific rather than computational, and the canvas states it: outside the chosen percentage's resolving window the placement is extrapolated, and under Rill/Van Winkle above 1.3 % the fit is clamped.
Screenshots
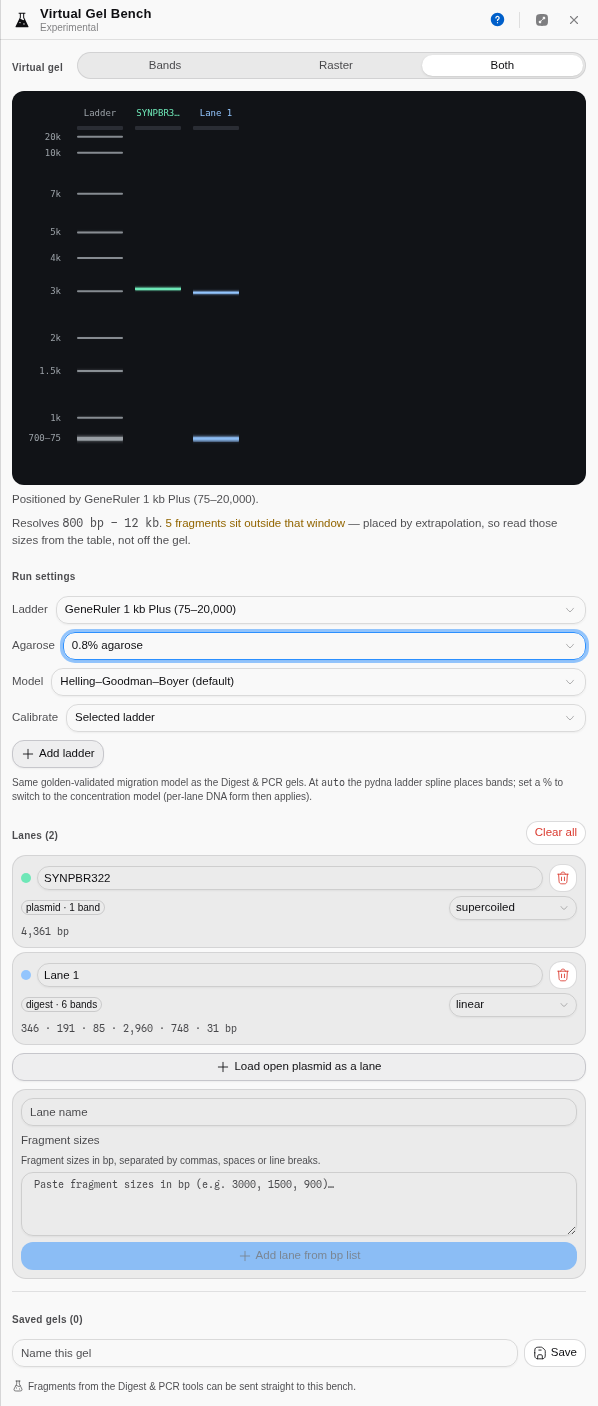
Two real lanes on the Virtual Gel Bench: uncut pBR322 run as supercoiled, beside its own six-fragment digest. Agarose is off its default at 0.8 %, the model select it reveals is showing, and the resolving-window sentence is under the gel.
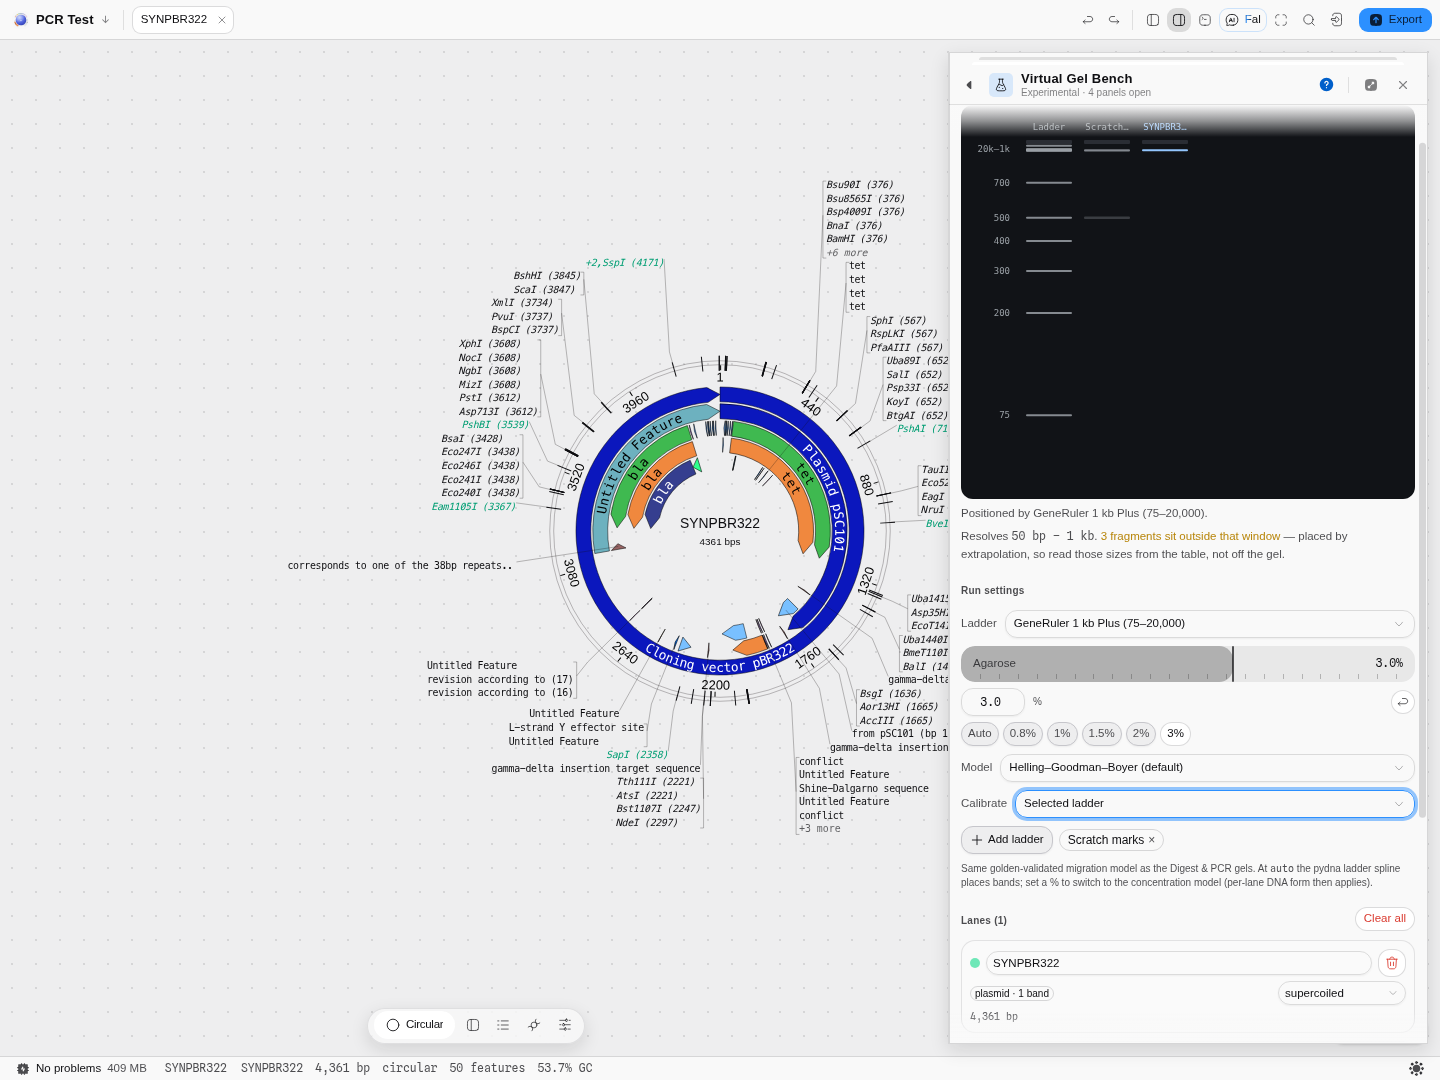
The calibrator driving: the whole gel, reference lane included, placed on a (bp, Rf) table read
off a photograph of a real gel rather than on the ladder's built-in curve.
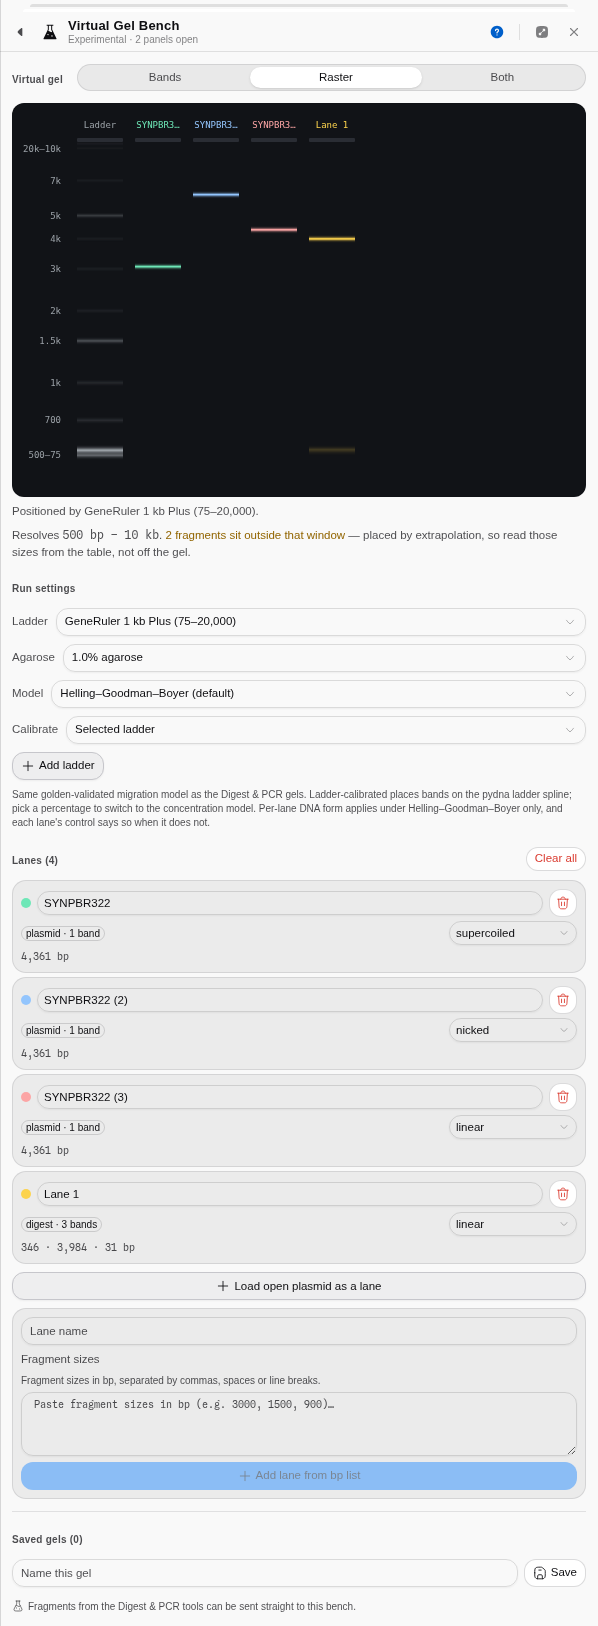
Raster mode: the camera-like render rather than measurable rectangles. Four lanes at 1 % agarose — the same 4,361 bp plasmid as supercoiled, nicked and linear, and beside them a real pBR322 EcoRI/HindIII/BamHI digest (346 · 3,984 · 31 bp) handed straight across from the Restriction Digest tool. The 31 bp fragment is below what this gel resolves, which is what the amber sentence under the gel is counting.
How this is checked
The migration model is a faithful port of pydna's gel module, and the band placements are verified against pydna's own output — including its rendered lane image, which is what the raster mode draws. The ladders are pydna's, with the relative-mobility values it read off real gel images. The Helling–Goodman–Boyer agarose law is validated against a second independent implementation.
One number is honestly labelled as not yet sourced: the separation strength of the Rill/Van Winkle law. Its published form is implemented and validated for shape, but the fit tables themselves are behind a paywall, so that law is offered as (approx.) rather than shipped as though it were measured — and Helling–Goodman–Boyer, which is validated, is the default.
Related
Written by the Gel Bench, Restriction Digest and the PCR tools. The fragments a gel lane carries are listed on the digest result; the molecule they were cut from opens on the sequence map.
Digest result
The digest result is the answer to 'what did my enzymes actually do to this molecule': the gel those fragments would run, and the table of every fragment with the cutter and overhang at each of its two ends.
Assembly report
The report is what an assembly run shows you once it has finished: the fragments your enzyme actually produced, which of them can join to which, and — for a Type IIS assembly — the slots those joins define.